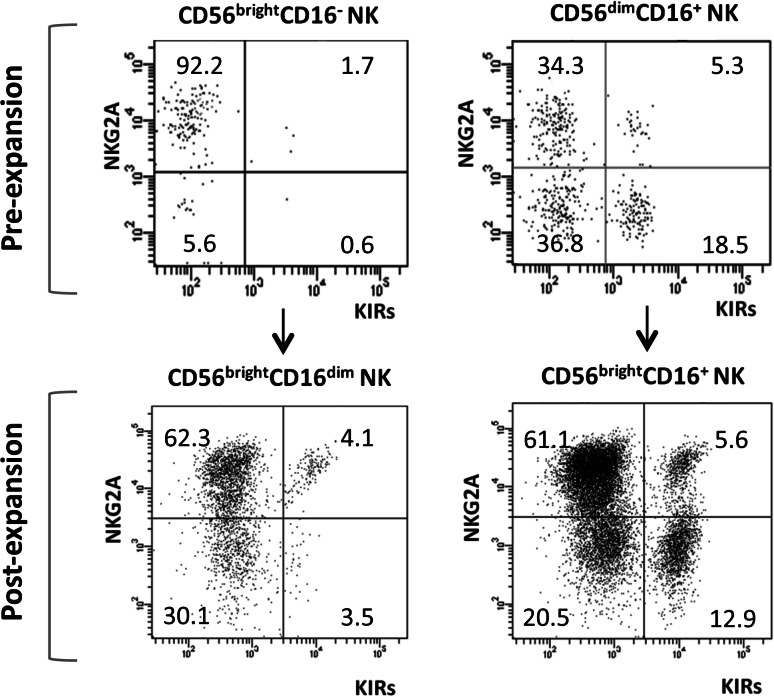
Fig. 4.
Comparison of NKG2A and inhibitory KIR (CD158a and CD158e) expression on NK cell subsets before and after expansion. The percentages of NKG2A+KIRs−, NKG2A+KIRs+, NKG2A−KIRs+ and NKG2A−KIRs− NK cells were analyzed by flow cytometric analyses. Representative FACS dot plots from one donor (n = 35) are presented

