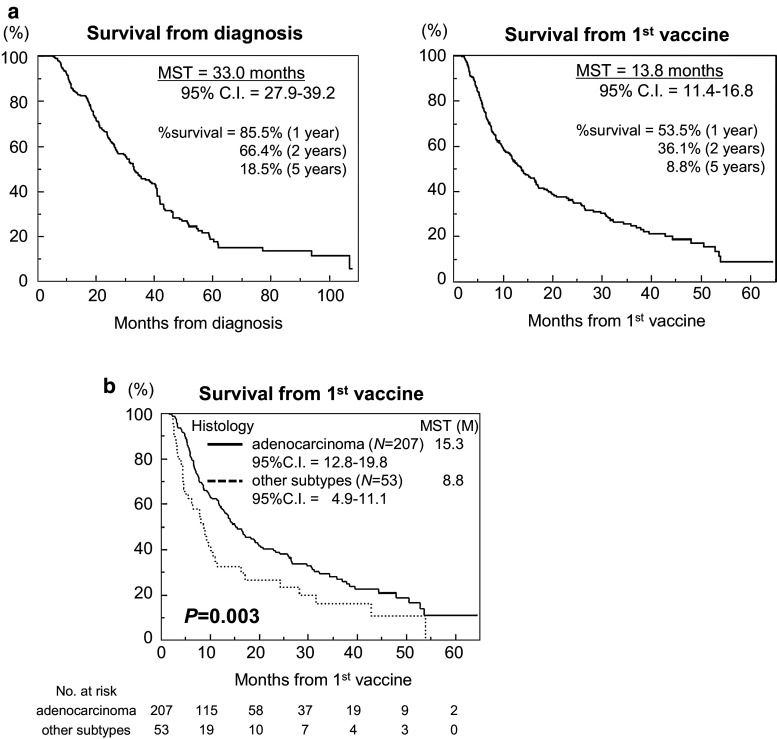
Fig. 1.
Overall survival (OS) a Kaplan–Meier plots of the OS times for 260 patients from the time of diagnosis (left graph, MST = 33.0 months) and from the time of first DC vaccination (right graph, MST = 13.8 months). b Kaplan–Meier plots of the OS times of patients with adenocarcinoma (n = 207, MST = 15.3 months) and those with other subtypes (n = 53, MST = 8.8 months) from the time of first DC vaccination (P = 0.003)

