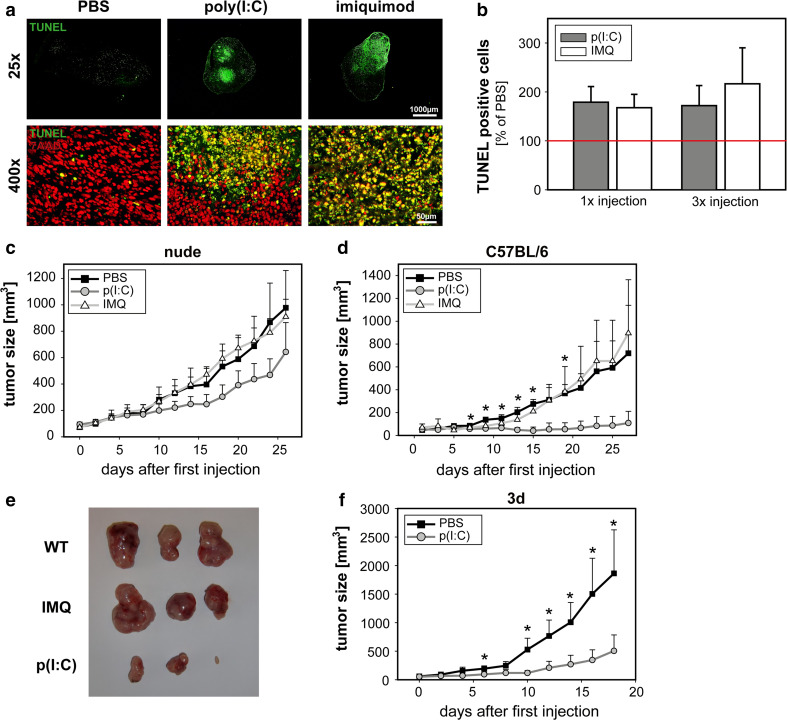
Fig. 2.
Poly(I:C) induces cell death in vivo and shows therapeutic effects in murine models. a and b 1 × 10⁶ FaDu cells were injected s.c. into nude mice. When tumor size had reached 5 mm in diameter, one or three intratumoral applications of poly(I:C), imiquimod or PBS were administered. Mice were killed 1 day after treatment. In frozen sections of FaDu tumors, cell death was determined using TUNEL kit. a Representative examples of TUNEL staining 1 day after last treatment are depicted. Green TUNEL, Red 7-AAD nuclear staining. Upper panel whole tumor overview for TUNEL staining. Lower panel colocalization of the TUNEL signal with 7AAD nuclear staining. b Quantification of dead cells in FaDu tumors was determined by calculating the area of TUNEL positive cells in relation to the entire tumor area. TUNEL positive cells in control PBS-treated mice were set as 100 %. c 5 × 10⁵ FaDu cells were injected s.c. into nude mice. When tumor size had reached 5 mm in diameter, intratumoral application of poly(I:C) (filled circle), imiquimod (open triangle) or PBS (filled square) was administered five times every other day (day 1, 3, 5, 7, 9) and tumor size was measured. The means + SEM of seven [poly(I:C)], six (imiquimod) and four (PBS) mice obtained from two independent experiments are shown. d 5 × 10⁵ MOPC cells were injected s.c. into immunocompetent C57Bl/6 mice. When tumor size had reached 5 mm in diameter, intratumoral application of poly(I:C) (filled circle), imiquimod (open triangle) or PBS (filled square) was administered five times every other day and tumor size was measured. The mean ± standard deviation of four [poly(I:C)] and three (imiquimod and PBS) mice per group are shown. P value (t test) is indicated. e 5 weeks after the first therapeutic injection, the experiment was terminated and tumors were dissected. Shown are three representative examples for each treatment group. f 5 × 10⁵ MOPC cells were injected s.c. into ‘triple d’ (3d) mice with defective endosomal TLR signaling. Application of poly(I:C) and PBS and tumor measurement was performed as described in (d). The mean ± SEM of two independent experiments are shown with a total number of seven to eight mice per group. P value (t test) is indicated

