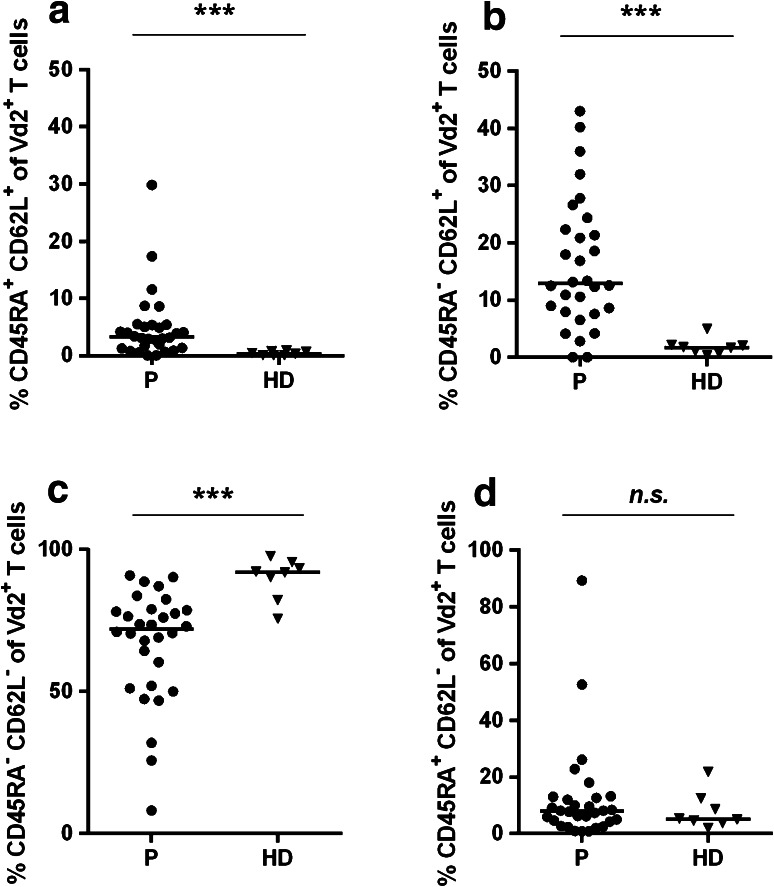
Fig. 5.
Vδ2+ T cells in gastric cancer patients shift toward CD45RA+CD62L+ and CD45RA−CD62L+ T cell phenotype (staining Panel-4). PBMCs from 30 gastric cancer patients (filled circles) and eight healthy donor samples (filled triangles) were analyzed with regard to CD45RA+CD62L+ Vδ2+ T cells (a), CD45RA−CD62L+ Vδ2+ T cells (b), CD45RA−CD62L− Vδ2+ T cells (c), CD45RA+CD62L− Vδ2+ T cells (d). The horizontal black lines represent median. p values were obtained with a Mann–Whitney test, ***p < 0.001. HD healthy donors, P patients, PBMCs peripheral blood mononuclear cells

