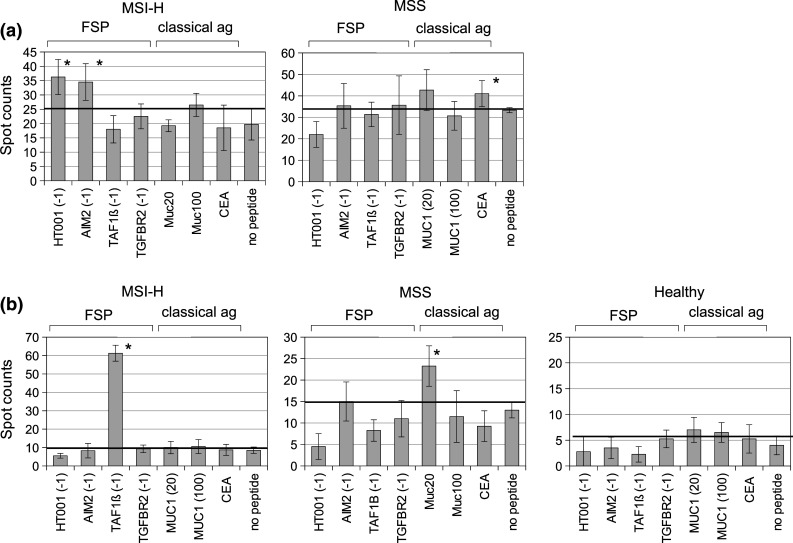
Fig. 1.

IFN-gamma ELISpot spot counts per 5 × 10⁴ T cells for tumor-infiltrating (a) and peripheral (b) T cell samples from representative MSI-H and MSS CRC patients as well as one healthy donor. Bars represent mean spot numbers ± standard deviation. Significant elevated spot numbers compared to the negative control are marked with asterisk
