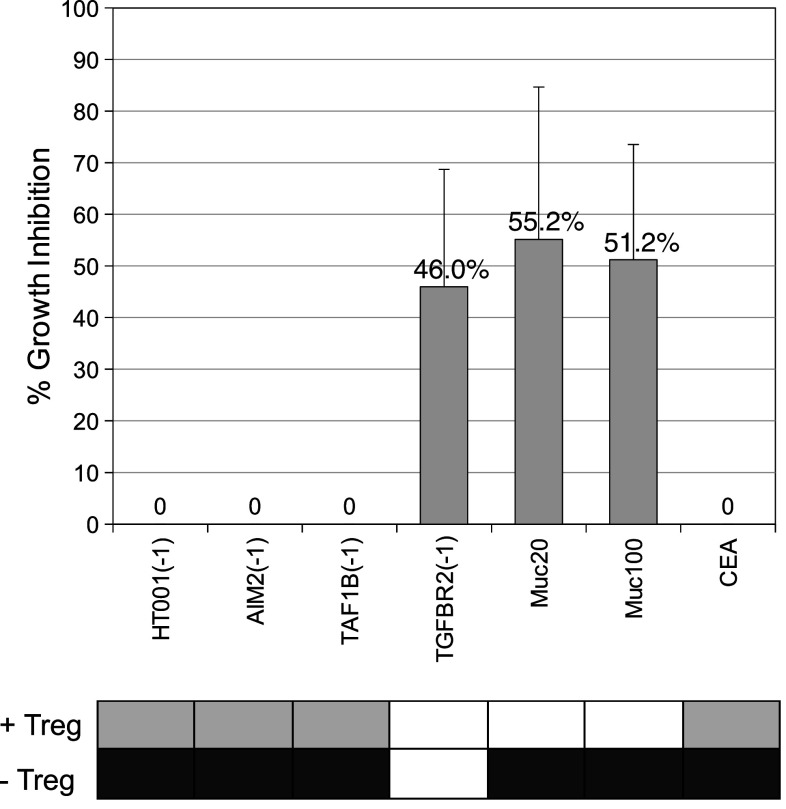
Fig. 4.
Representative T cell sample for comparison of antigen-specific T cell responses in Treg-cell-undepleted (light gray) and Treg-cell-depleted T cells (dark gray) with percentage of growth inhibition in Treg specificity assay (calculated as the difference between mean DPM no peptide control and mean DPM antigen, divided by mean DPM of the no peptide control) including standard deviation

