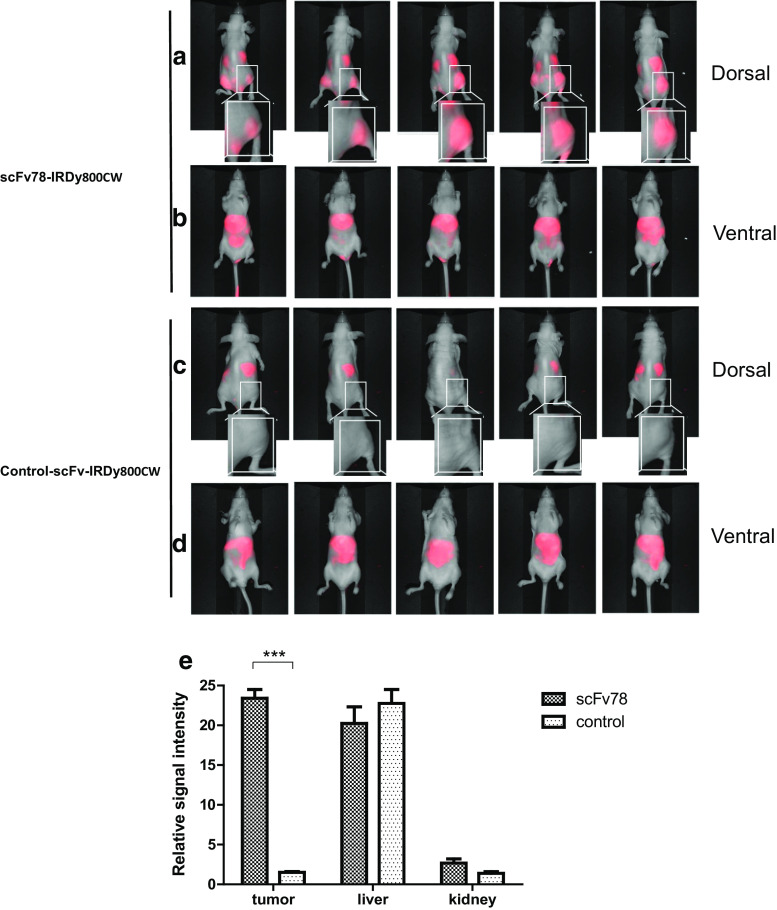
Fig. 5.
In vivo tumor targeting by scFv78. This figure represents the biodistributions of scFv78 (a, b) and control scFv (c, d) in five animals 6 h post-injection in the ventral and dorsal positions. Magnified views of the framed tumor regions in two groups are shown in the insets. Relative signal intensities of the tumor, liver and kidneys of both groups were plotted against the background intensity (e), ***p < 0.001

