
Fig. 6.
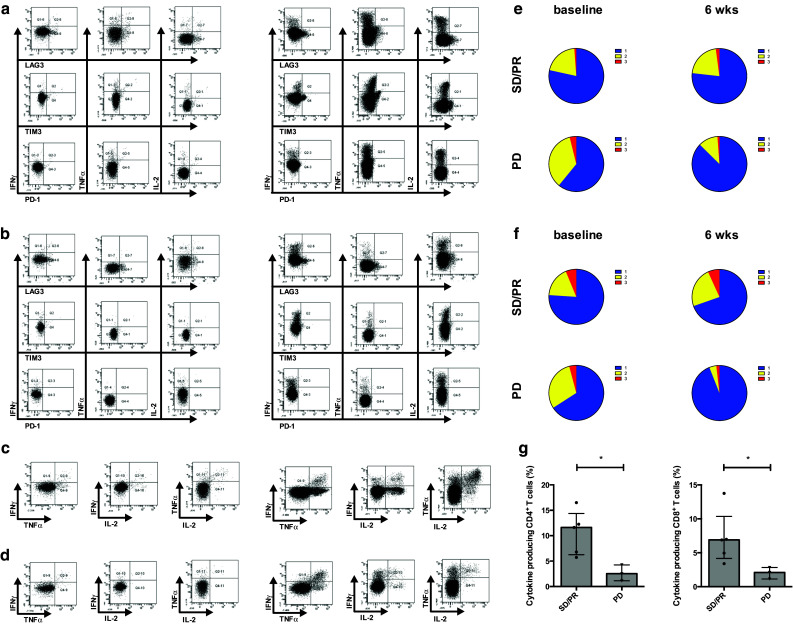
Expression of inhibitory molecules on CD4+ and CD8+ T cells and progressive disease is associated with reduced production of cytokines. Representative flow cytometry profiles showing LAG3, TIM3 or PD-1 expression profiles on CD4+ T cells (a) and CD8+ T cells (b) simultaneous with ICS for IFN-γ, TNF-α and IL-2 and representative flow cytometry profiles of the production of IFN-γ, TNF-α and IL-2 on CD4+ T cells (c) and CD8+ T cells (d) of patient 16 (axitinib, SD) after stimulation with anti-CD3/CD28 beads at baseline (left panel) and at 6 weeks (right panel) post-treatment. Pie charts showing the proportion of CD4+ T cells (e) and CD8+ T cells (f) displaying 1–3 functions determined after polyclonal stimulation at baseline and at 6 weeks after treatment for patients with SD/PR (upper panel; n = 5) or PD (lower panel; n = 3). Percentages of total cytokine-producing CD4+ and CD8+ T cells as determined at 6 weeks comparing patients with SD/PR (filled circle; n = 5) and patients with PD (inverted triangle; n = 3) (g)