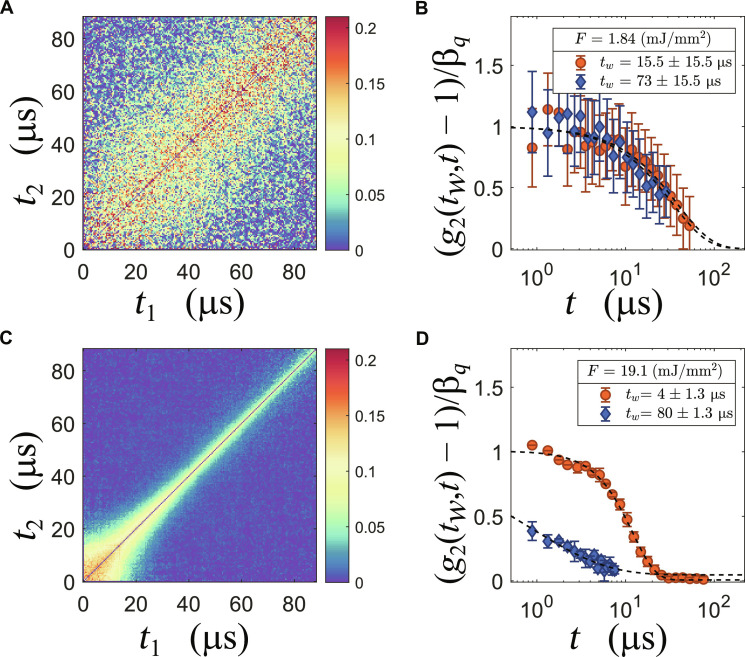
Fig. 2. Examples of the observed dynamics at q = 0.087 nm−1 in two fluence regimes.
(A and C) The TTCM for a low fluence (1.84 mJ/mm2) and a high fluence (19.12 mJ/mm2) measurement. (B and D) The corresponding time-resolved correlation functions g2(tw, t) at two tw: Orange circles show a tw at the beginning of the train, and blue diamonds show a tw at the end of the train. To fit the blue points in (D), both baseline and contrast were kept fixed at the values obtained from the fit at the beginning of the train.

