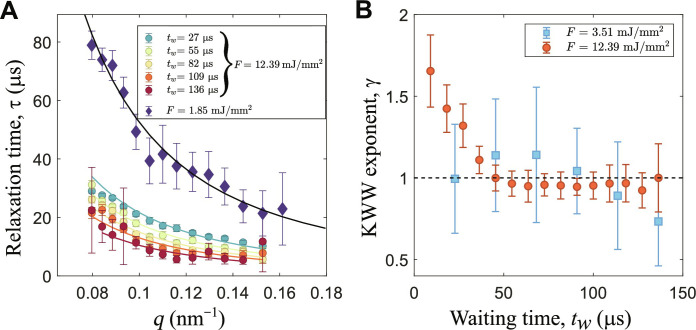
Fig. 3. Relaxation times and KWW exponents for samples with thin shell and BIS 8 wt %.
(A) Relaxation times as a function of q for two fluences. For F = 1.85 mJ/mm2, the average over the whole TTCM is performed. The black line is the fit of the Stokes-Einstein relation and returns a diffusion constant of 1.9 ± 0.1 nm2/μs. The colored data are the pulse-resolved average relaxation times for F = 12.2 mJ/mm2. (B) KWW exponent at different tw for two fluences of F = 12.2 mJ/mm2 and F = 3.51 mJ/mm2.

