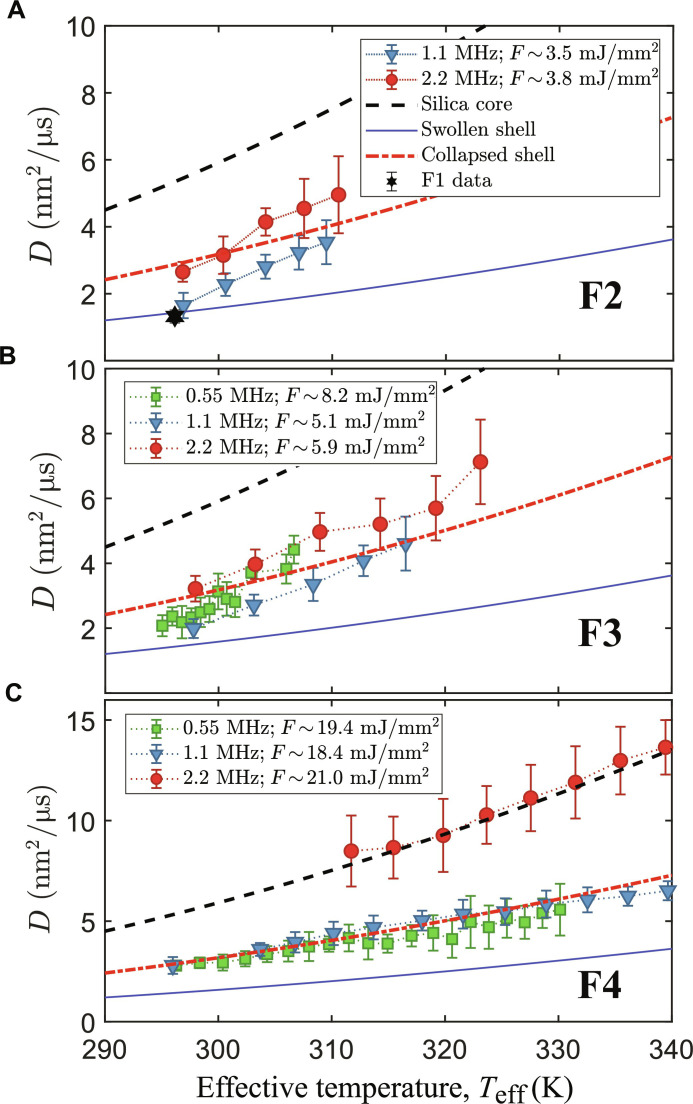
Fig. 4. Diffusion constant for samples with thick shell and 8 wt % BIS as a function of Teff for different repetition rates and different fluences.
(A) Low fluence limit of regime F2, for comparison, the measured diffusion constant obtained from an F1 run is also reported (black star). Because of the limited signal-to-noise ratio, only data for 1.1 and 2.2 MHz are reported. (B) Intermediate fluences (regime F3). (C) High fluences (regime F4). The lines represent the limit values for the completely swollen (solid blue), fully collapsed (dash-dotted red), and pure silica core (dashed black) state.

