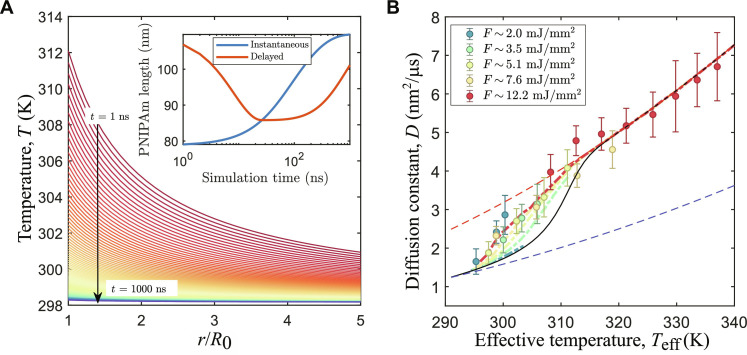
Fig. 5. Results from time-resolved model.
(A) Calculated temperature as a function of r/R0 and t after a temperature jump of 14 K. In the inset, the calculated elongations of the PNIPAm chains are reported for a situation in which there is no delay in the response (blue) and a delay of 10 ns and 800 ns in the collapse and swelling, respectively. (B) Model results for 1.1-MHz data and thick shell and 8 wt % BIS compared with the experimental data (model: dot-dashed lines; data: circles). The dashed lines are limit values that mark the diffusion of swollen (blue) and collapsed (red) particles. The black line represents the instantaneous response limit.

