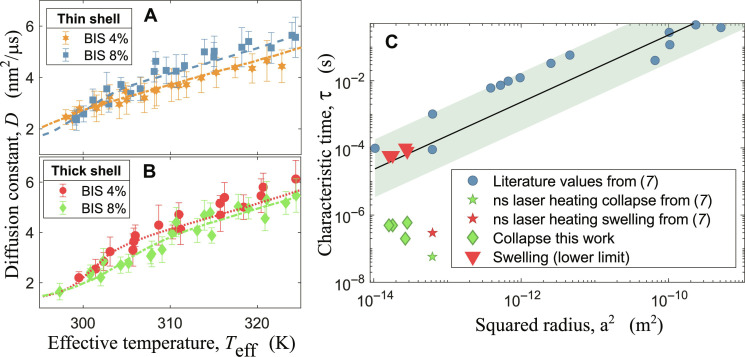
Fig. 6. Fitted models and results compared with literature.
(A) Data for thinner shell and different BIS concentrations, data at 8 wt % BIS (blue squares) are obtained from 1.125-MHz runs, while 4 wt % BIS (orange hexagons) were obtained from 0.55-MHz runs because, for technical reasons, it was not possible to measure F3 data for the latter sample. (B) Data for 1.125-MHz runs for thicker shell at different BIS concentrations of 4 wt % (red circles) and 8 wt % (green diamonds). The fits shown here used a fixed τswell = 80 μs (dashed lines of respective colors). (C) Results of the present work, diamonds and triangles, reported together with literature values from (7) (stars) and references therein (circles). The line is a linear fit to the literature data and the shaded area is the confidence band. ns, nanosecond.

