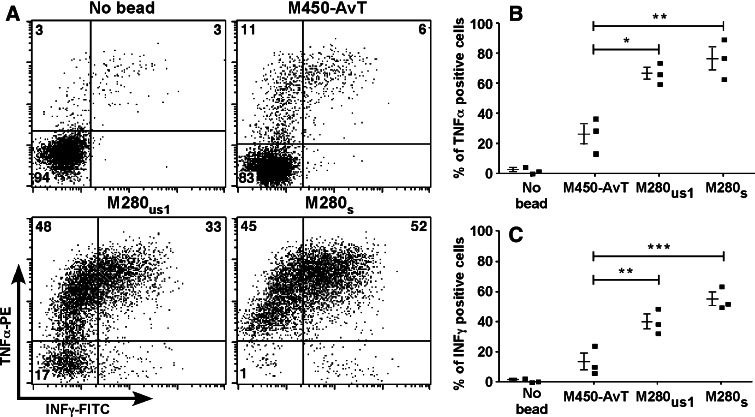
Fig. 8.
Activation of Melan-A specific cell-lines by M450-AvT, M280s or M280us1 multimers was assessed by evaluating INFγ and TNFα production by intracellular staining following a 6 h incubation at a 1:1 ratio in the presence of brefeldin A. a A representative experiment showing double staining in the four conditions. Percentages of cells in each quadrant are indicated. b Summary of the results obtained with three distinct Melan-A specific cell lines in terms of percentages of cells producing TNFα (b) and INFγ (c). ***P < 0.001, **P < 0.01, *P < 0.05 by ANOVA and Bonferroni post-test

