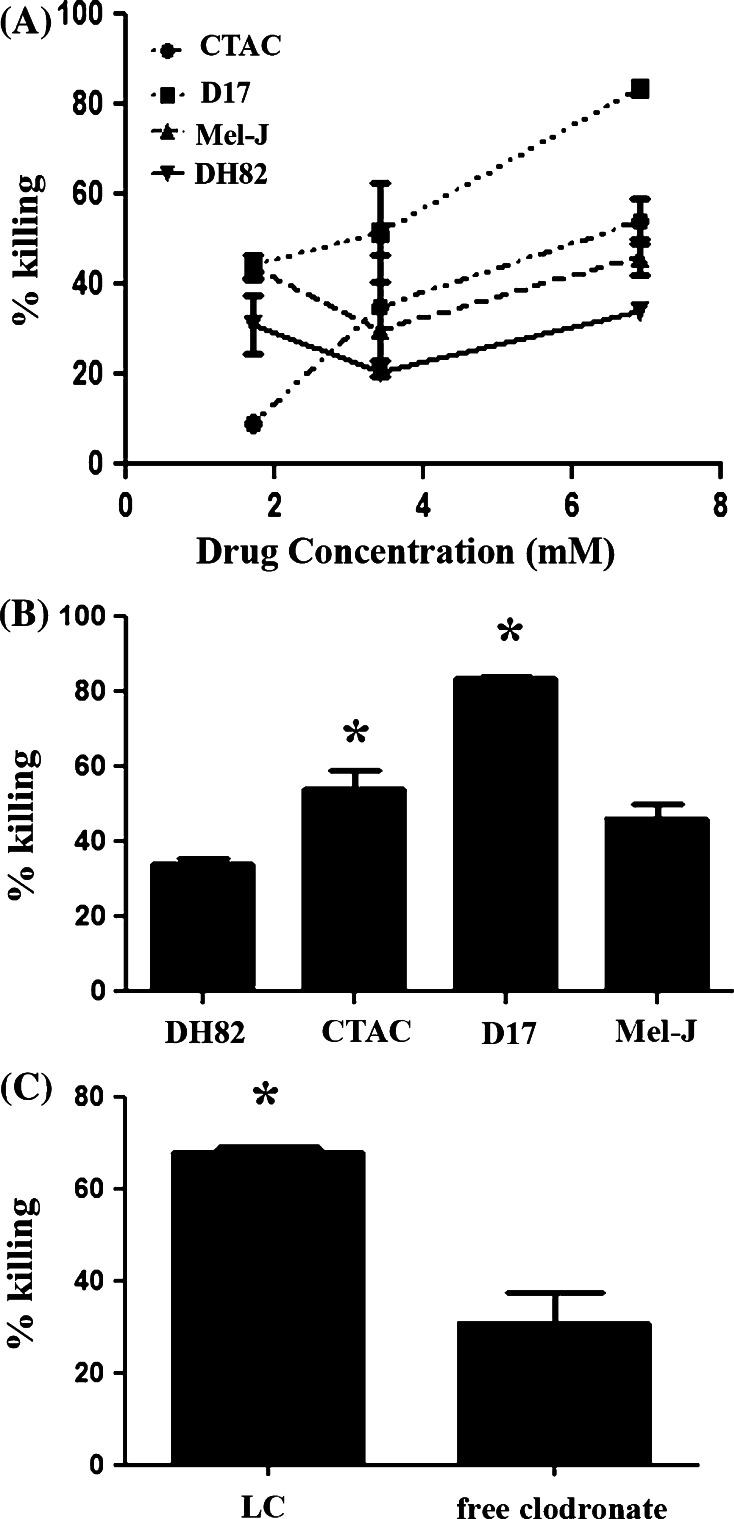
Fig. 2.
Susceptibility of tumor cells to killing by free clodronate versus liposomal clodronate. Killing of a canine MH cell line (DH82) was compared to killing of three non-phagocytic canine tumor cell lines (thyroid carcinoma {CTAC}, malignant melanoma {Mel-J} and osteosarcoma {D17}). The percentage of killing was determined after 72 h of incubation with varying concentrations of free clodronate (a) or at a maximal concentration of 6.7 mM free clodronate (b). Differences amongst the groups were assessed using ANOVA followed by Bonferroni’s post-test. Although there were no significant differences between the dose response curves (a), there was significantly more killing (*, p < 0.05) in the D17 and CTAC cell lines when compared to DH82 cells at the 6.7 mM concentration of clodronate. In (c), DH82 cells were incubated with a 5% solution of LC or with 1.7 mM solution of free clodronate for 72 h and cell viability was assessed by MTT assay, as described in “Methods”. The percentage specific killing of DH82 cells elicited by LC was determined. Killing of DH82 cells elicited by LC and free clodronate was compared statistically using Student’s t test. Significant differences are denoted by * (p < 0.001). The data shown are representative of three independent experiments

