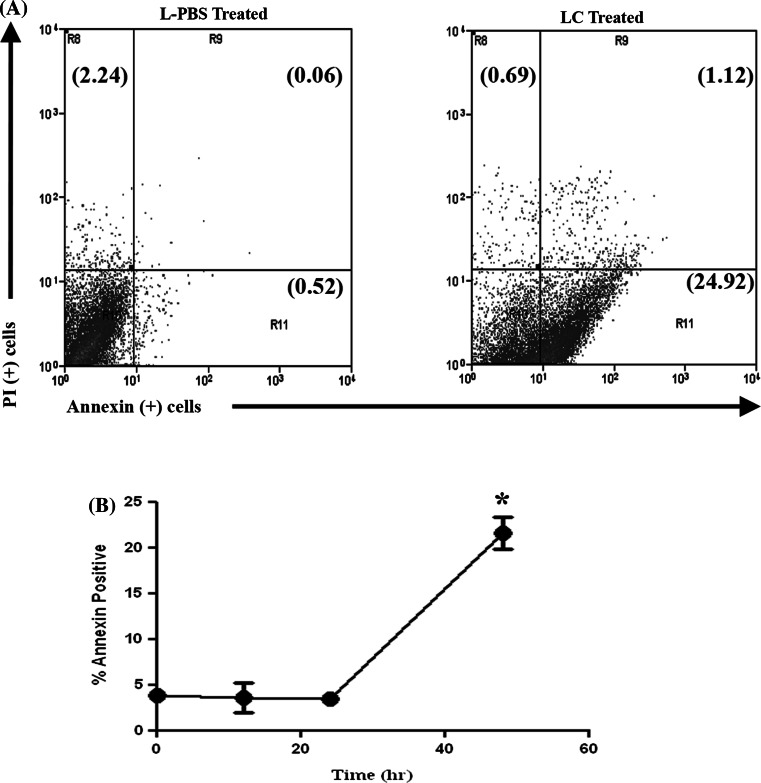
Fig. 6.
Induction of apoptosis in MH cells following treatment with LC. DH82 cells were incubated with 5% LC or L-PBS for the indicated time period and induction of apoptosis was assessed using flow cytometry and Annexin V and propidium iodide (PI), as noted in “Methods”. In (a), representative dot plot at 48 h of DH82 MH cells treated with LC or L-PBS. In (b), the time course of induction of apoptosis was assessed, using DH82 cells. The mean percentage of Annexin V positive cells (which included both early and mid-apoptosis cells) at varying time points after treatment with LC was determined. The percentage of apoptotic cells at each time point was compared by Student’s t test with values for the 0 h control; (*, p = 0.001). These data are representative of three independent experiments

