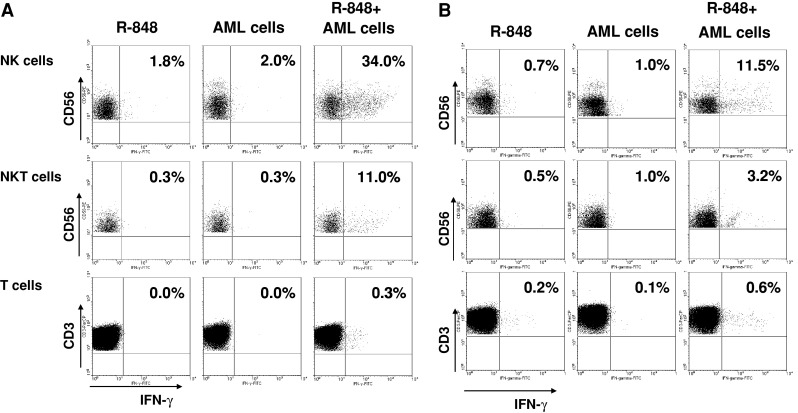
Fig. 5.

Determination of IFN-γ-producing cells after coculturing PBMC, AML cells, and R-848. Intracellular staining of IFN-γ production in NK cells, NKT cells, and T cells after coculturing PBMC, AML cells, and/or R-848. Dot plots shows the percentage of IFN-γ-positive cells within the NK cell population (above), NKT cell population (middle), and T cell population (below). a Representative result of cocultures of allogeneic PBMC with primary AML cells from AML P3 (n = 3). The results are representative for experiments done with AML cells from 4 different patients. b Representative result of cocultures of allogeneic PBMC with NB-4 cells (n = 4)
