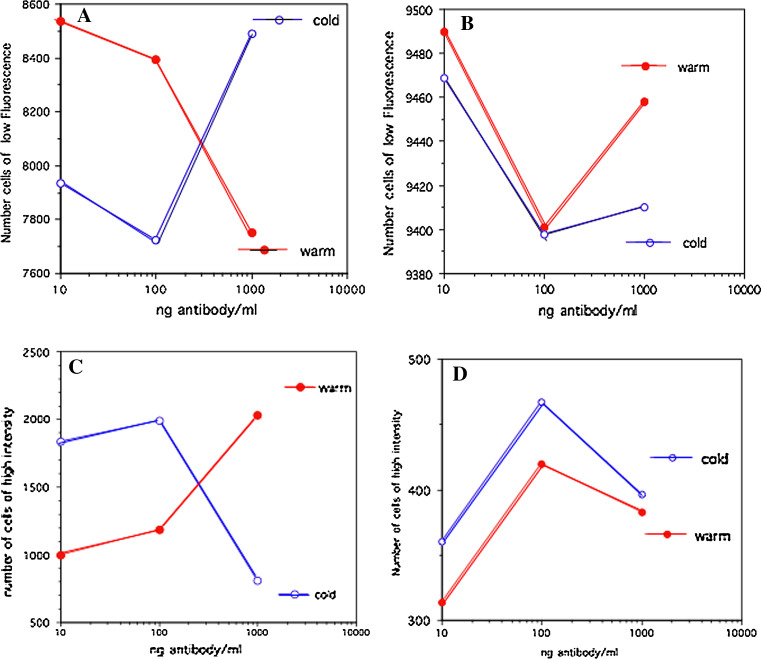
Fig. 7.
Comparison of FACS staining of live H1650 cells at 4 and 37°C [open circle (cold) and solid circle (warm), respectively]. a, b FACS gated at low-fluorescence intensity a using dilutions of homophilic Herceptin, and b dilutions of Herceptin. c, d FACS gated at high-fluorescence intensity c using dilutions of homophilic Herceptin, and d dilutions of Herceptin

