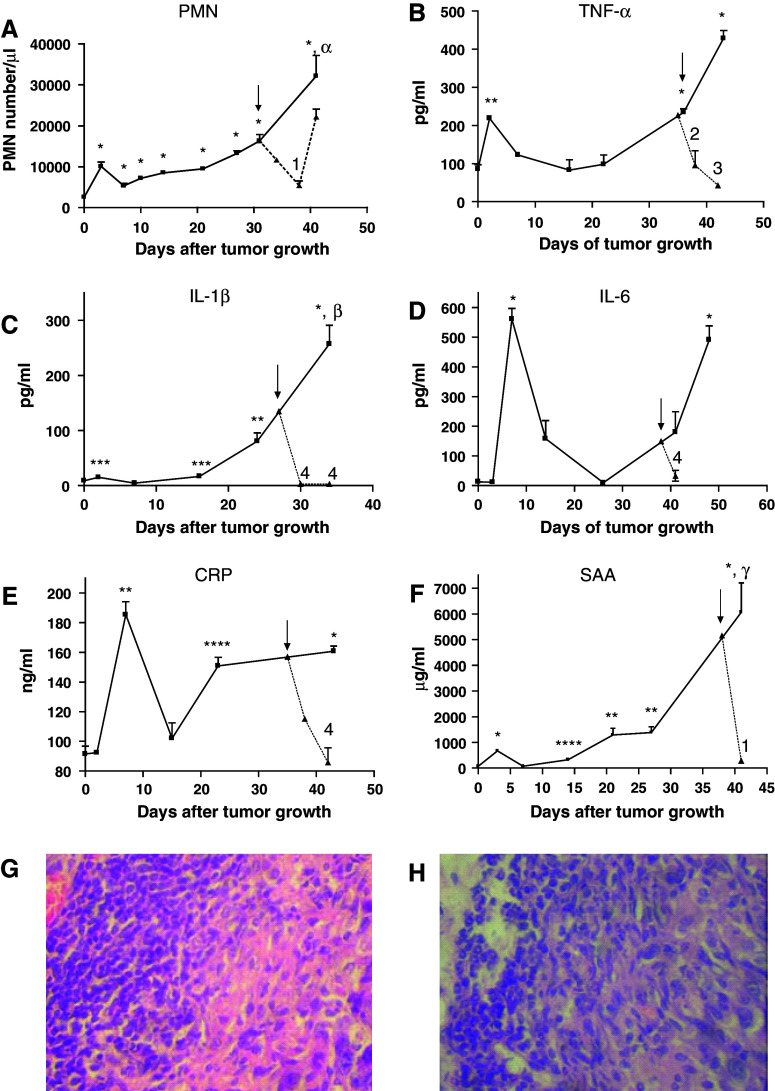
Fig. 2.
Number of circulating polymorphonuclear neutrophils (PMN) per μl (a) and serum concentration of the pro-inflammatory cytokines TNF-α (b), IL-1β (c), IL-6 (d) and the phase acute proteins CRP (e) and SAA (f) throughout MC-C tumor growth (solid lines). Dotted lines represent the values observed after treatment with a single dose (0.75 mg/Kg) of dexamethasone by the intraperitoneal route; day of treatment is indicated by arrow. Each point represents the mean ± SE of 2–4 determinations for the cytokines and phase acute proteins and the mean ± SE of 3–10 determinations for the PMN cell counts. Comparison with normal values: * P < 0.001, ** P < 0.01, *** P < 0.05, **** P < 0.02. Comparison between the second peak (days 34–48) and the first peak (days 2–7) of systemic inflammation: α P < 0.002, β P < 0.001; γ P < 0.01. Comparison between dexamethasone-treated and untreated mice: 1 P < 0,05, 2 P < 0.002, 3 P < 0.001, 4 P < 0.01. Peritumoral infiltrate preferentially composed by lymphocytes in a small (<500 mm3) tumor (g) or preferentially composed by PMN in a large (1,500–2,000 mm3) tumor (h) (×400)

