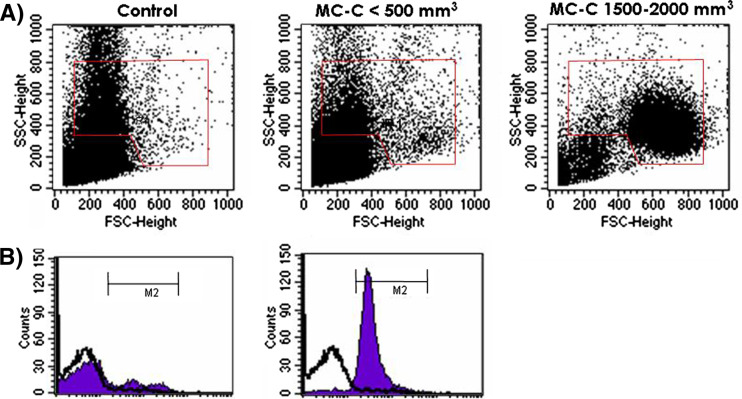
Fig. 3.
a Change in phenotype of circulating PMN throughout MC-C tumor growth. b Pattern of activation of circulating PMN from mice bearing a large MC-C tumor (1,500–2,000 mm3 size; black area, graphic on the right) as compared with normal mice (white area) and mice bearing a small MC-C tumor (<500 mm3; black area, graphic on the left) as determined by a brightly fluorescent FL-1 product of dihydrorhodamine 123 upon reactive oxygen species generation. Similar results were obtained in three additional experiments

