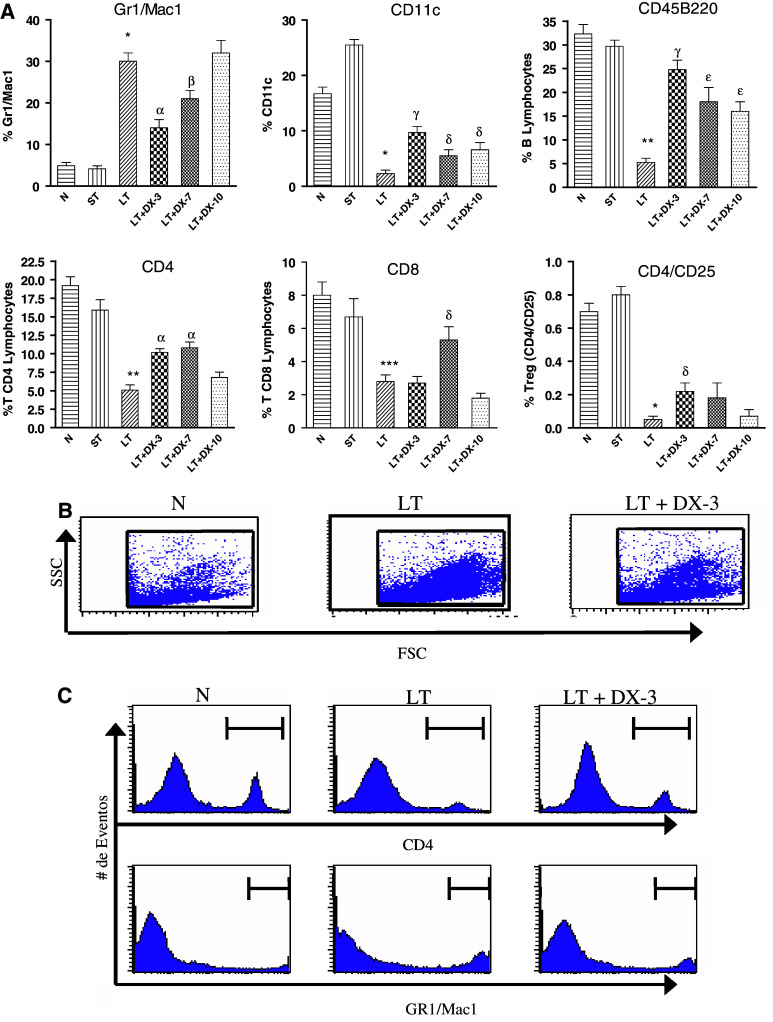
Fig. 4.
a Change in phenotype of splenocytes throughout MC-C tumor growth and following DX treatment. Splenocytes from normal mice (N), mice bearing a small tumor (size < 500 mm3; ST) and mice bearing a large tumor (size 1,500–2,000 mm3) untreated (LT) or 3, 7 and 10 days after treatment with dexamethasone (LT + DX-3, LT + DX-7 and LT + DX-10) were studied. Splenocytes from all the groups were stained with 100 ng of fluoresceinated anti-Gr1 and anti-Mac1, anti-CD11c, anti-CD45 B220, anti-CD4, anti-CD8 and anti-CD 4/CD25. The percentage of cells staining with the irrelevant isotype-matched controls has been subtracted from the values obtained with the specific antibodies. Fluorescence was analyzed via flow cytometry. Bars represent the percentage of each cellular type as compared with the total number of splenic nucleated cells. Comparison between LT versus N: * P < 0.001; ** P < 0.01; *** P < 0.05. Comparison between LT + DX-3 or LT + DX-7 versus LT: α P < 0.002. β P < 0.02; γ P < 0.001; δ P < 0.05; ε P < 0.01. These values represent the mean ± ES of four similar experiments. Absolute number of splenocytes per spleen was similar in LT [(5.53 ± 0.80) × 108, n = 4 experiments] and LT + DX-3, LT + DX-7 and LT + DX-10 [(5.37 ± 0.82) × 108, n = 12]. On the other hand, a significantly lower number of splenocytes per spleen was seen in N [(1.33 ± 0.17) × 108, n = 4, P < 0.01 vs. LT] and ST [(2.05 ± 0.37) × 108, n = 4, P < 0.05 vs. LT ]. b Dot blot showing, in one representative experiment, the change in phenotype of splenocytes from LT as compared with LT + DX-3 and N mice. c Histograms from the representative experiment shown in b, showing splenic CD4+T lymphocytes and Gr1+/Mac1+ PMN from N, LT and LT + DX-3 mice

