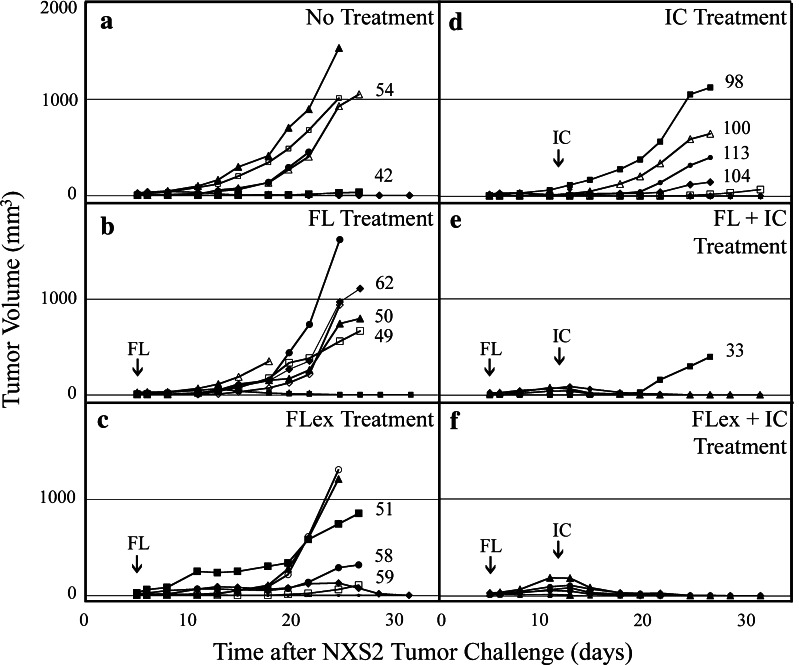
Fig. 2.
Modulation of MHC class I expression. Groups of A/J mice (6 mice in group A and 8 mice in all other groups) were injected with NXS2 cell i.d. on day 0 and received a no treatment, b 200 μg mFL DNA by HLV in both limbs on day 5, c 200 μg mFLex DNA by HLV in both limbs on day 5, d 10 μg/d hu14.18-IL-2 IC (day 12–15), e both FL DNA + IC, or f both FLex DNA + IC. Data represents NXS2 tumor growth for individual animals. Primary tumors were harvested on day 27 following NXS2 cell injection and individually profiled for H2Dd expression. The specific MFI ratio for H2Dd expression is represented numerically and is adjacent to tumor growth graph for that particular tumor lesion. Due to progressive tumor growth, some mice were euthanized prior to the tumor harvest date. Small (FL) and large (IC) arrows indicate HLV gene delivery and hu14.18-IL-2 treatment initiation dates, respectively

