Fig. 1.
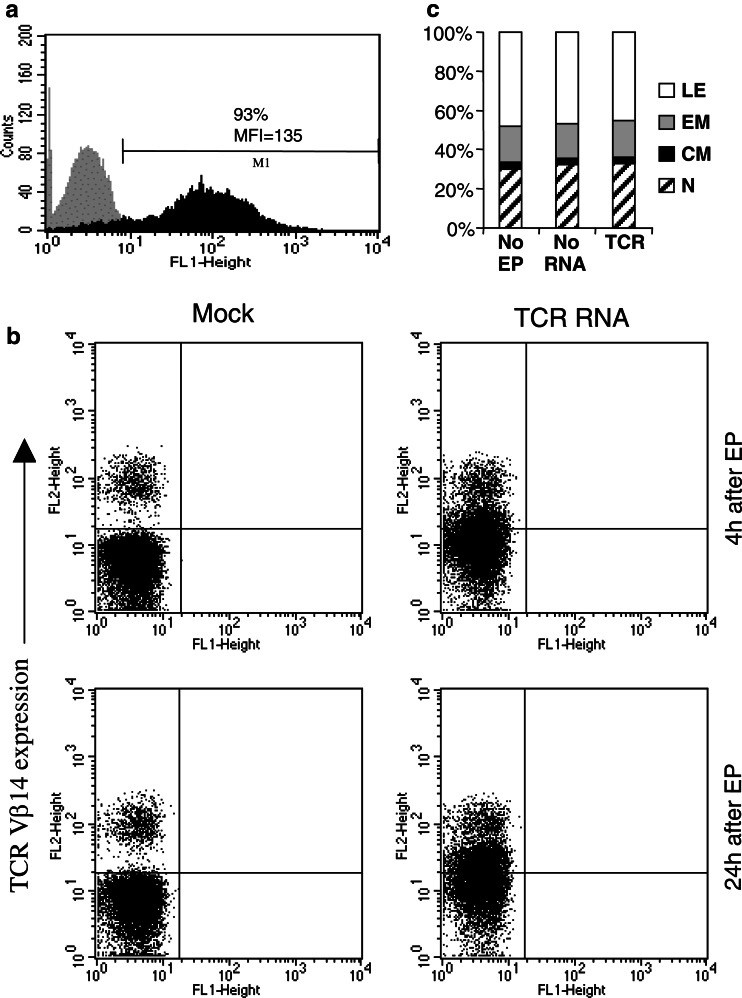
EGFP and TCR expression of RNA-transfected CD8+ T cells. a CD8+ T cells were electroporated with EGFP RNA and EGFP expression in these cells was determined by FACS analysis 4 h after electroporation (black histogram). CD8+ T cells electroporated without RNA served as negative control (gray histogram). b CD8+ T cells were electroporated with TCR α and β chain RNA (TCR RNA) and TCR Vβ14 surface expression on these cells was determined by FACS analysis 4 and 24 h after electroporation (EP). CD8+ T cells electroporated without RNA served as negative control (Mock). c The influence of electroporation and TCR expression on T-cell phenotype was examined by CCR7 and CD45RA staining 24 h after electroporation. Assignment of T cell phenotype was as follows: lytic effectors (LE): CD45RA+/CCR7−, effector memory (EM): CD45RA−/CCR7−, central memory (CM): CD45RA−/CCR7+, naïve (N): CD45RA+/CCR7+. All data are representative for three standardized independent experiments

