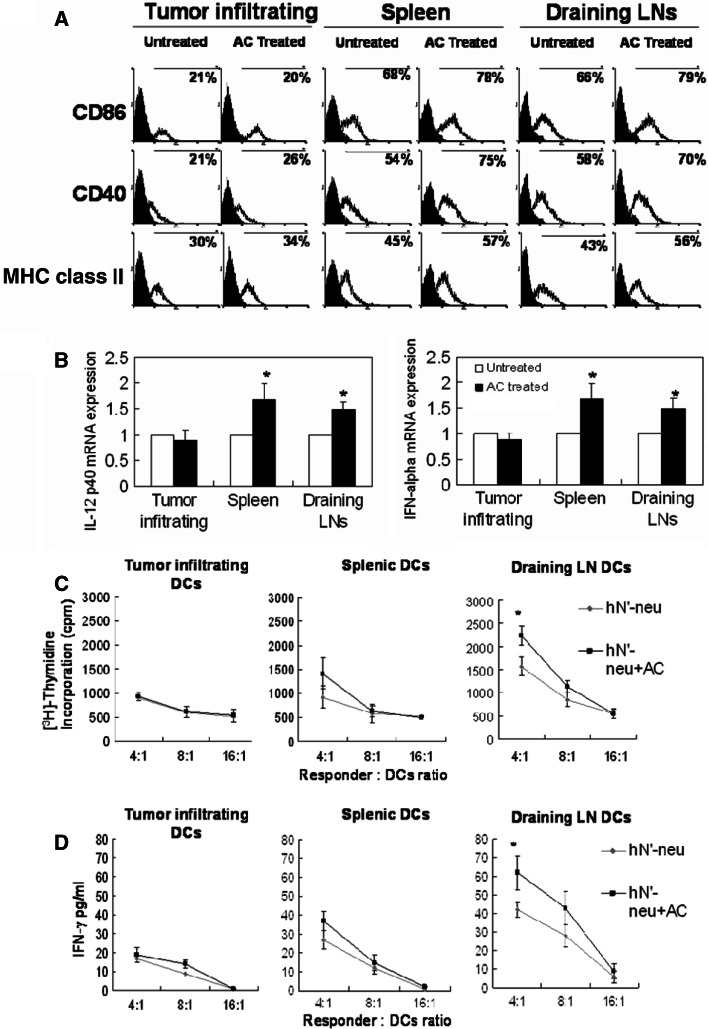
Fig. 7.
Phenotypic and functional characterization of CD11c+ DCs purified from draining inguinal LNs, spleen, or the tumor site in the different groups of mice. a CD11c+ DCs were purified from AC-treated or untreated control mice using MACS and stained with Abs to detect CD40, CD86, and I-Ak (MHC class II). The values in open histograms indicate the percentage of cells within the indicated gate. The filled histograms represent staining with the isotype-matched mAb control. Staining with the isotype control resulted in less than 2% positive cells (not shown). The histogram data are representative of two independent experiments that yielded similar results. b. IFN-α and IL-12 mRNA were detected in purified CD11c+ DC from AC-treated or untreated control mice using quantitative real-time RT-PCR. The data were normalized to HPRT expression in each sample, and means ± SEM are pooled from two independent experiments (n = 10–14 mice/group). Asterisk indicates a statistically significant difference when compared with untreated control group (p < 0.05). c, d Effect of CD11c+ cells from hN’-neu-treated or hN’-neu DNA-AC-treated mice on ErbB2 antigen-stimulated T cell responses. Purified CD11c+ cells were irradiated and then incubated with T cells from hN’-neu DNA vaccinated mice. The proliferative capacity (c) and IFN-γ cytokine production (d) were measured as described in the “Material and methods”. Data shown in the figure represent mean ± SEM of triplicate wells from a single experiment (n = 5–7 mice/group). The experiments were repeated two times and similar results were obtained. Asterisk indicates a statistically significant difference when compared with mice vaccinated with the hN’-neu DNA vaccine alone (p < 0.05)

