Fig. 3.
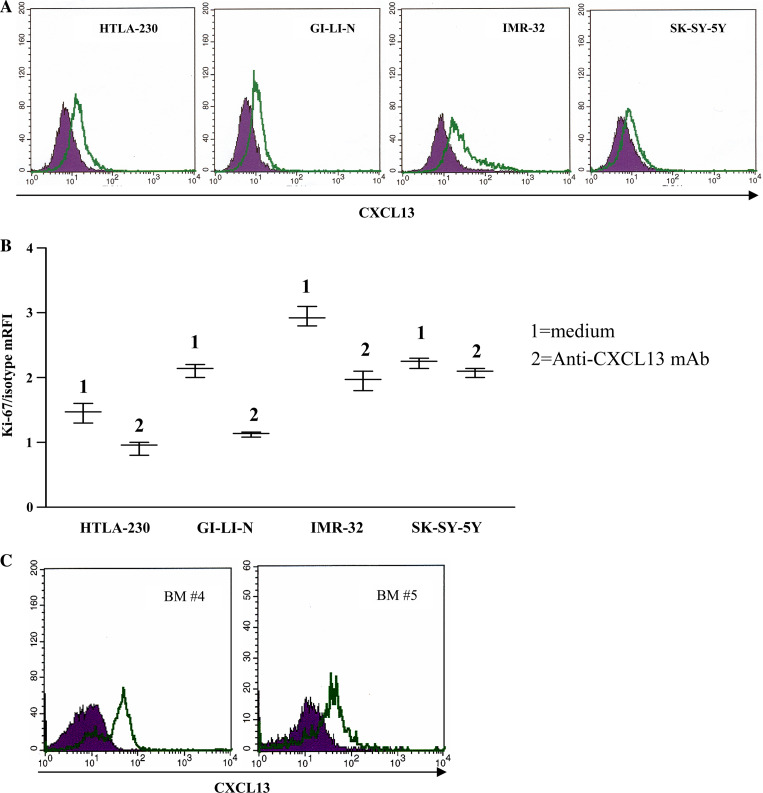
CXCL13 production by and proliferation of NB cell lines. a CXCL13 intracellular staining in NB cell lines, as assessed by flow cytometry. Dark profile in each panel is isotype control of irrelevant specificity. Open profile is staining obtained with anti-CXCL13 mAb. b Proliferation of NB cell lines was tested in cells grown in medium in the absence (1) or presence (2) of a neutralizing anti-CXCL13 mAb for 36 h. Experiments with each cell line were repeated four times at different time points. Results are expressed as mean relative fluorescence intensity (mRFI) calculated as the ratio between Ki-67 and isotype control fluorescence intensities. Whisker lines represent highest and lowest values for each cell line. Horizontal lines represent median values. c CXCL13 intracellular staining in CD45+ cell fraction from two BM aspirates (BM #4 and #5), as assessed by flow cytometry. Dark profile in each panel is isotype control of irrelevant specificity. Open profile is staining obtained with anti-CXCL13 mAb

