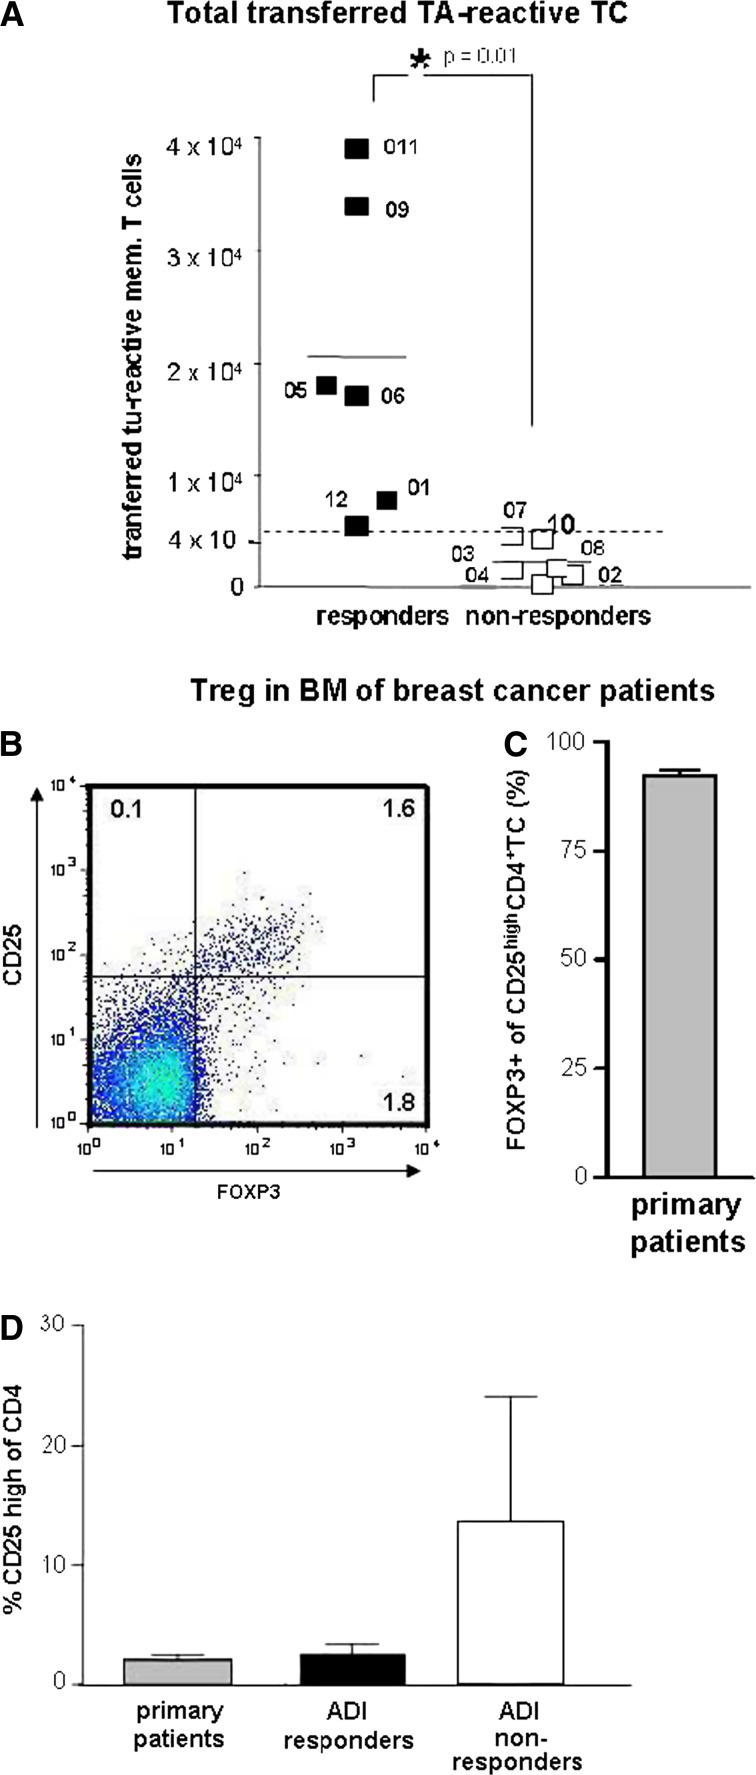
Fig. 4.
Pre-therapeutic immune parameters. a Estimated numbers of tumour-specific T cells transferred into patients (specific frequencies of tumour-reactive T cells in bone marrow before treatment × numbers of stimulated T cells). Black squares immunol responders, white squares immunol non-responders. Left scatter column immunol responders only, right column immunol non-responders only. P = 0.01, Student’s T-test. The numbers (Px) indicate different study patients. b–d Treg in bone marrow of breast cancer patients. Frequencies of Treg among CD4 T cells in bone marrow of primary breast cancer patients were determined by flowcytometry, using CD25 and FOXP3 as Treg marker (b). Since nearly all (92%) of CD25high CD4 T cells (N = 13) also expressed FOXP3 (c) Treg in bone marrow of study patients or primary breast cancer patients (d) were quantified by high expression of CD25. Bars represent mean ± SEM frequencies of Treg among CD4+ bone marrow T cells from primary (non metastasized) breast cancer patients (grey bar), ADI responders (black bar) and ADI non responders (white bar)

