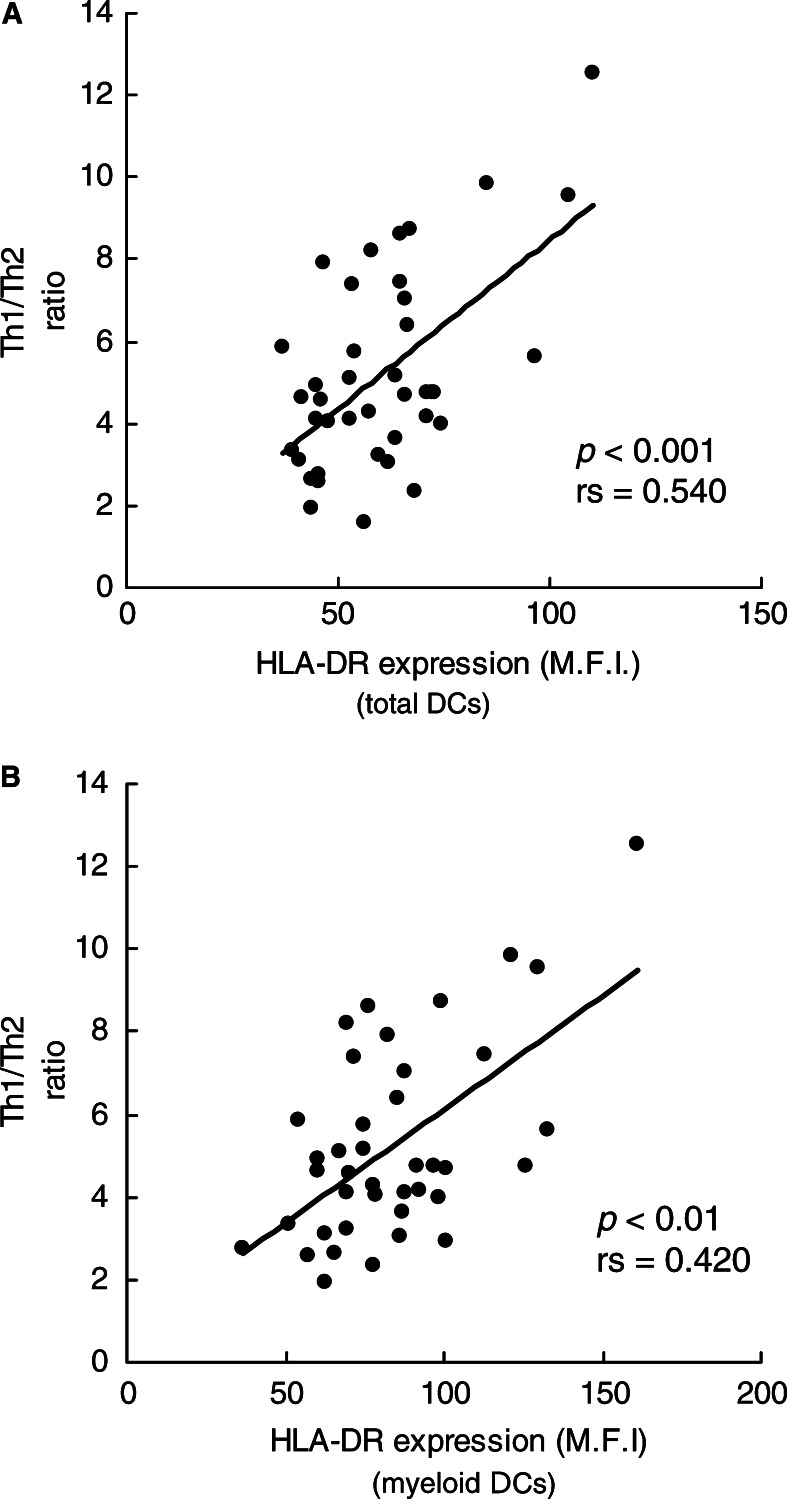
Fig. 3.
The relative level of HLA-DR expression in total circulating DCs (in A) and in myeloid DCs (in B) in peripheral blood obtained from patients with SCCHN correlated positively with the Th1/Th2 ratio. The expression of HLA-DR on DCs and intracellular cytokine production were measured by flow cytometry. Each dot represents an individual patient

