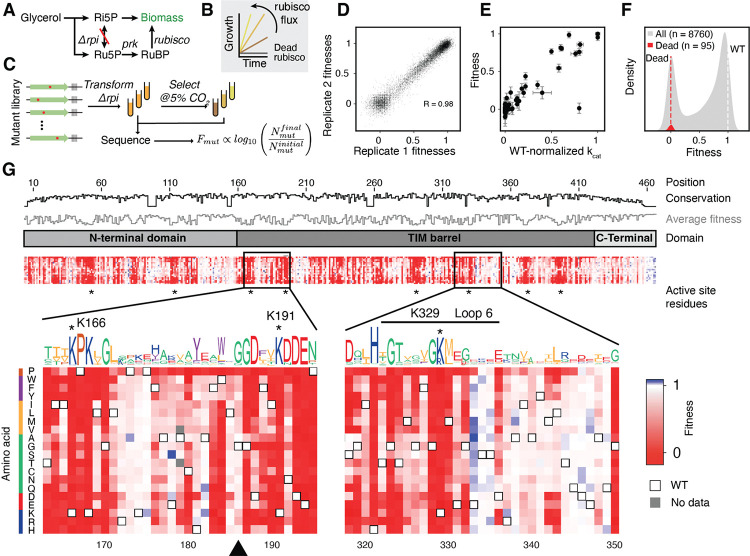
Figure 1: A deep mutational scan individually characterizes all single amino-acid mutations in rubisco.
A) A summary of the metabolism of Δrpi the rubisco-dependent strain. B) Δrpi grows with a rate that is proportional to the flux through rubisco. C) Schematic of the library selection. A library of rubisco single amino-acid mutants was transformed into Δrpi then selected in minimal media with supplemented glycerol at elevated CO2. Samples were sequenced before and after selections and barcode counts were used to determine the relative fitness of each mutant. D) Correspondence between 2 example biological replicates, each point represents the median fitness among all barcodes for a given mutant. E) Fitness of 77 mutants with measurements in previous studies compared to the catalytic rates measured in those studies (). The outlier is I190T, see supplemental text for discussion. F) Histogram of all variant fitnesses (grey) were normalized between values of 0 and 1 with 0 representing the average of fitnesses of mutations at a panel of known active-site positions (red distribution, average is plotted as a red dashed line) and 1 representing the average of WT barcodes (white dashed line). G) A heatmap of variant fitnesses. Conservation by position and the sequence logo were determined from a multiple sequence alignment of all rubiscos. Black triangle indicates G186, an example of a position with high conservation that is mutationally tolerant.

