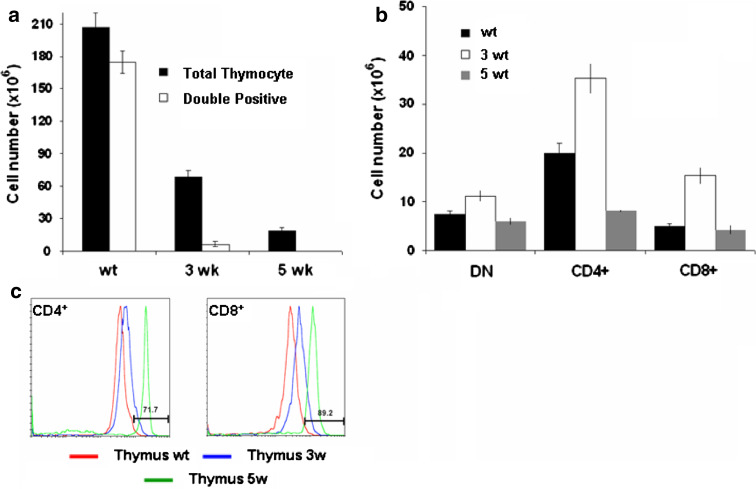
Fig. 2.
T-cell development in the thymus of glioma bearing mice: a absolute numbers of total thymocytes and double positive subset; b absolute number of thymocyte populations (DP, DN cell, SP-CD4+ or SP-CD8+). The number of thymocytes in each population was calculated by multiplying the percentage of each population by the total number of thymocytes; c Comparison of surface expression of CD4 and CD8 in SP thymocytes in glioma bearing mice compared wt littermate. Cells were stained with CD4 and CD8 for definition of the developmental stage. Values represent the mean fluorescence intensity ± SD

