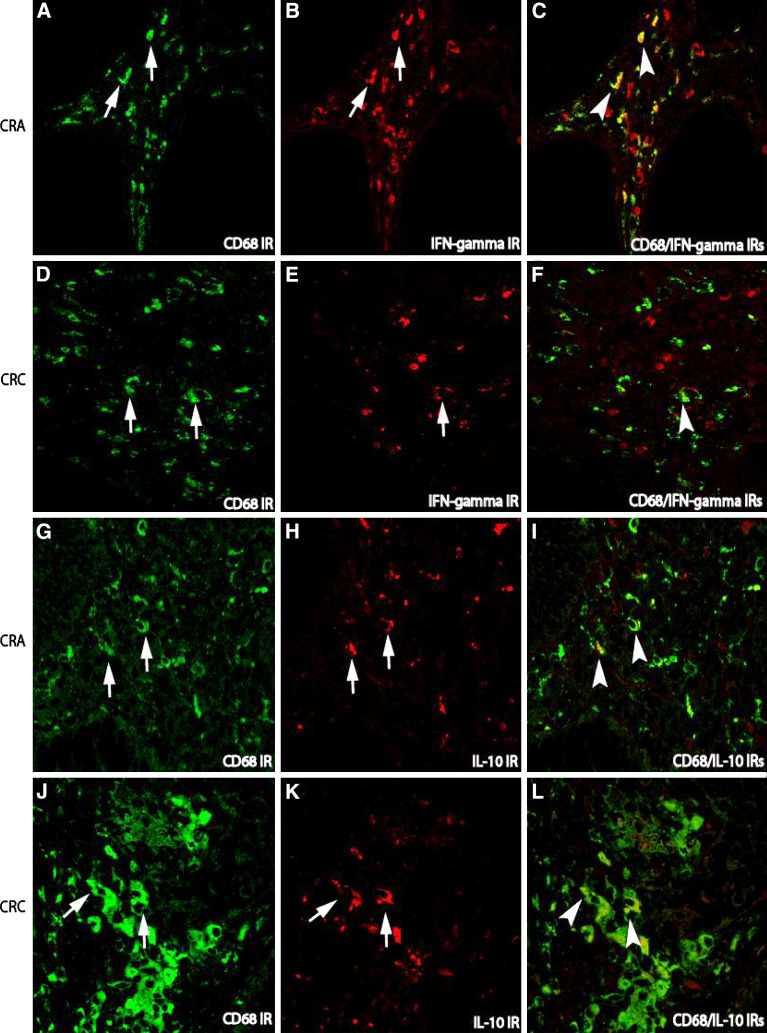
Fig. 4.
Double immunofluorescence staining for the examination of cytokine-producing macrophages in the stroma of adenoma–carcinoma sequence. In both CRA and CRC, the number of macrophages labeled with CD68 IR (FITC, green) was increased (arrows a for CRA and d for CRC). While the number of Th1 cytokine IFN-gamma expressing cells (TRITC, red) in CRA (arrows b) was higher than that in CRC (arrows e). Thus, in CRA, many co-localization (arrow heads c) of CD68/IFN-gamma could be shown in the stroma as compared with CRC (f). The IR of Th2 cytokine IL-10 (TRITC, red) could be detected in both CRA (arrows h) and CRC (arrows k). However, the double IRs of CD68 with Th2 cytokine IL-10 in the stroma of CRC (arrow heads l) was stronger that than in CRA (arrow heads i). (Double immunofluorescence staining, original magnification ×400)

