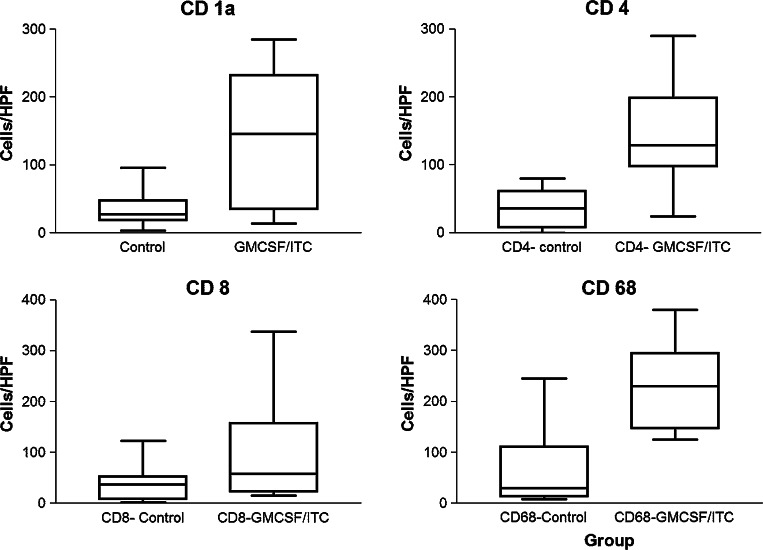
Fig. 4.
Quantitation of high power field immune cell infiltrate counts in control versus GM + ITC treated animals. There was variability in the cells per randomly quantified high powered field secondary to the focal nature of some of the infiltrates. Box–whisker plots for each for each of the cells stained are depicted (CD 1a, P = 0.0005; CD 4, P = 0.0005; CD 8, P = 0.1655; CD 68, P = 0.0158)

