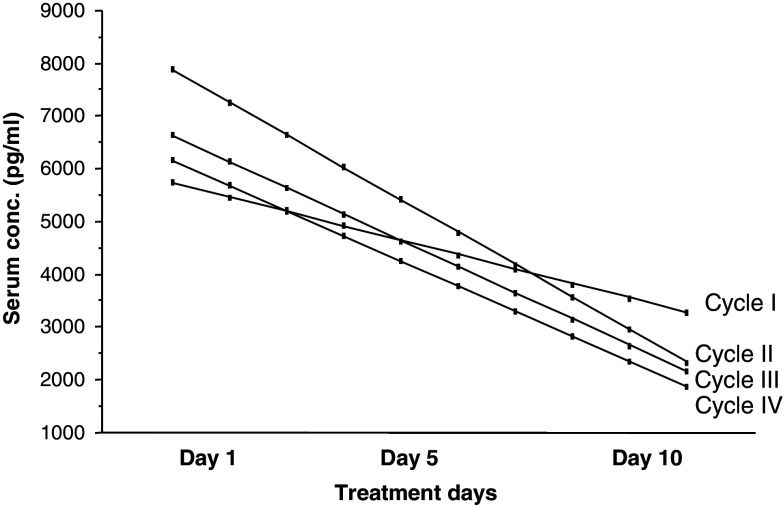
Fig. 2.
GM-CSF peak serum concentration (pg/ml) during the 10 days treatment in the four treatment cycles. Data also include results obtained from patients treated with anti-EpMAb/GM-CSF/α-IFN/5-FU according to Protocol C (see Sect. “Materials and Methods”). Results are presented as fitted regression lines for patients treated with a GM-CSF dose of 200–250 μg/m2/day having at least two measurements in each cycle. One sample statistics showed a significant decrease in GM-CSF peak serum concentration over the 10 days in all treatment cycles (P = 0.02, n = 22; P = 0.002, n = 14; P = 0.05, n = 12 and P = 0.012, n = 5 for treatment cycles number I–IV, respectively)

