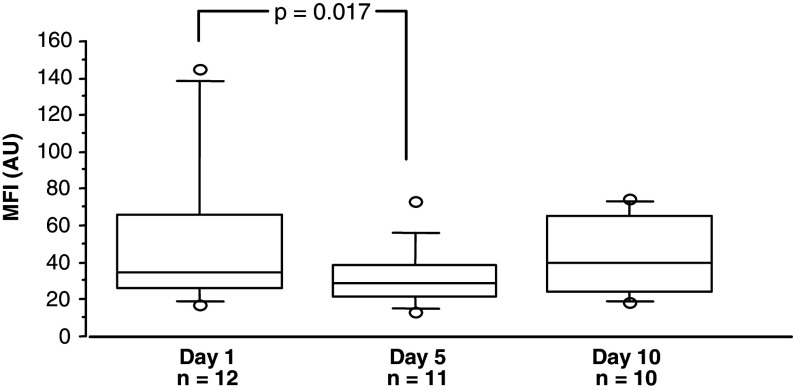
Fig. 6.
Total mean fluorescence intensity (MFI, arbitrary units) of GM-CSFR α-subunit expression on neutrophils and eosinophils (CD66b) and monocytes (CD14) in CRC patients treated with GM-CSF for 10 days on days 1, 5 and 10. Wilcoxon signed rank test showed a significant decreased MFI day 5 (no. of pairs = 11) compared to baseline. For symbols see Fig. 3

