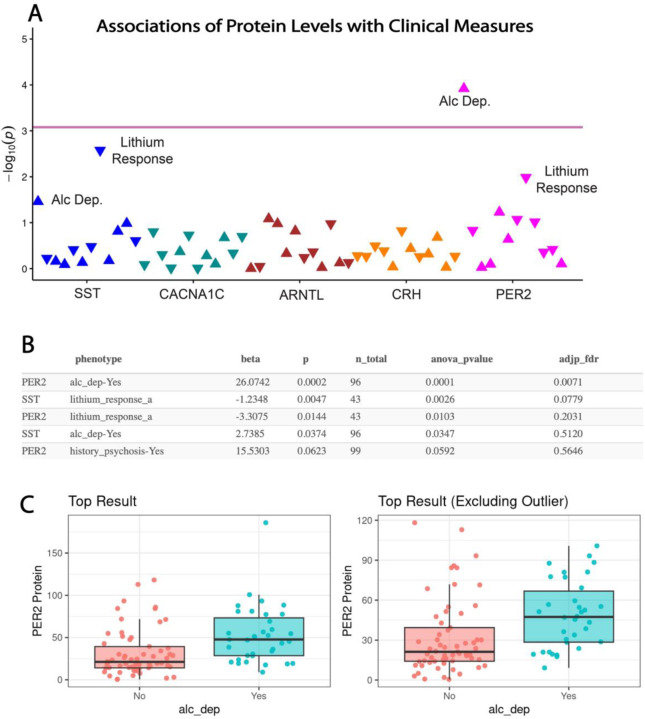
Figure 4. Associations of serum protein levels with clinical measures in subjects with bipolar disorder.
(A) PheWAS plot depicting associations of serum protein levels with clinical values. Pink line indicates adjusted P-value significance threshold. PER2 serum levels displayed a significant association with alcohol dependence, whereas associations of PER2 and SST serum levels with lithium response did not maintain significance after FDR correction. (B) Summary table of the top 5 associations with ANOVA p-values and adjusted FDR p-values. (C) Whisker plot depicting the top association of PER2 serum levels with alcohol dependence which maintained significance with the outlier removed. Protein values represent ng/ml for PER2.Lithium response-a represents Alda A score.

