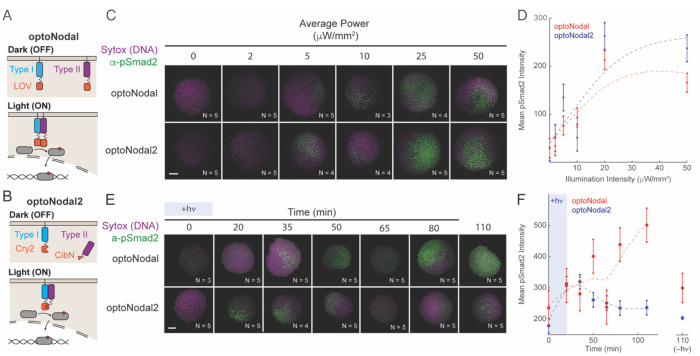
Fig. 1. Improved optoNodal2 reagents based on Cry2-Cib1N heterodimerization.
(A) Schematic of previously developed LOV-based optoNodal reagents21. Type I and Type II receptors are tethered to the membrane via a myristoylation motif (top). Blue light induces homodimerization between LOV domains, activating Nodal signaling (bottom). (B) Schematic of OptoNodal2 reagents. The myristoylation motif is removed from the Type II receptor, localizing it to the cytoplasm (top). Blue light induces heterodimerization of Cry2 and Cib1N, activating Nodal signaling (bottom). (C) Blue light intensity responses for optoNodal (top row) and optoNodal2 (bottom row) reagents. Embryos injected with indicated reagents were illuminated for 1 hour with 470 nm light with the indicated intensity. Nodal signaling was measured by α-pSmad2 immunostaining (green). Images are maximum intensity projections of representative embryos. Scale bar 100 μm. (D) Quantification of Nodal signaling activity from panel C. α-pSmad2 staining intensity was extracted from segmented nuclei in optoNodal (red) and optoNodal2 (blue) treatment groups; each point represents the average nuclear staining intensity from replicate embryos. Number of replicate embryos for each condition are indicated in the relevant images in panel C. Error bars denote the standard error of the mean. Dashed curves depict cubic smoothing spline interpolations. (E) Measurement of response kinetics for optoNodal (top row) and optoNodal2 (bottom row) reagents. Embryos injected with indicated reagents were illuminated for 20 minutes with 470 nm light. Nodal signaling was measured by α-pSmad2 immunostaining (green). Images are maximum intensity projections of representative embryos. (F) Quantification of Nodal signaling activity from panel E. α-pSmad2 staining intensity was extracted from segmented nuclei in optoNodal (red) and optoNodal2 (blue) treatment groups; each point represents the average nuclear staining intensity from replicate embryos. Number of replicate embryos for each condition are indicated in the corresponding images in panel E. Error bars denote the standard error of the mean. Dashed curves depict cubic smoothing spline interpolations. Background intensity of unilluminated embryos at the 110 minute timepoint are included (-hv) to indicate baseline levels of signaling activity.

