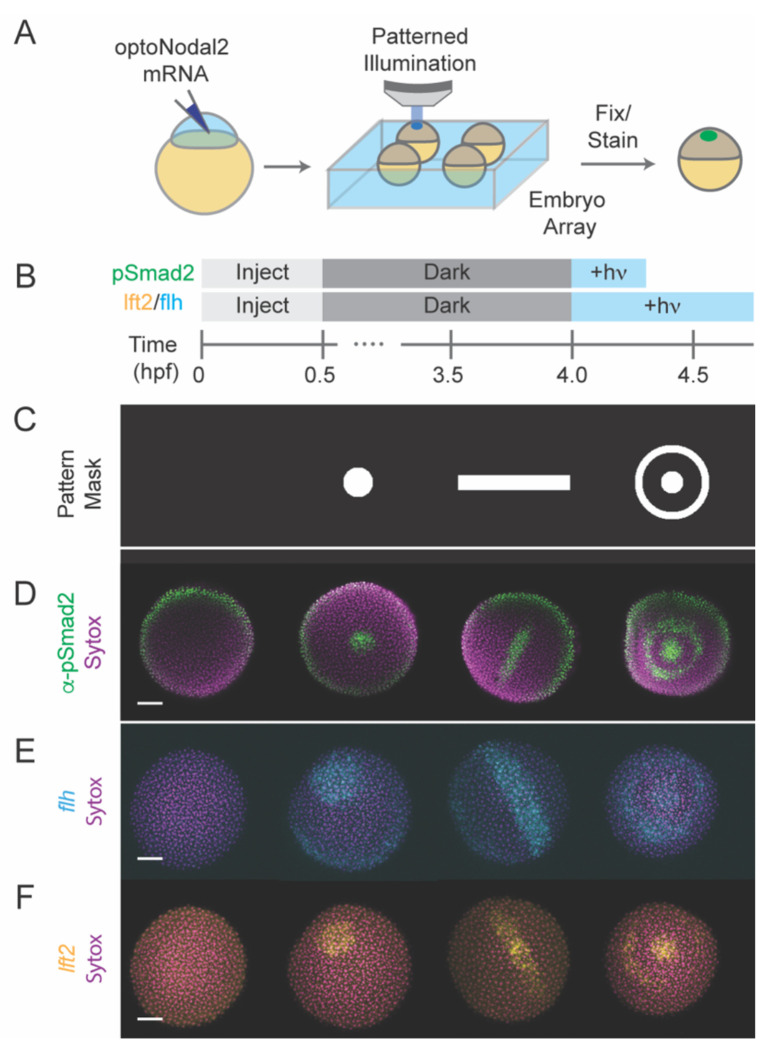
Fig. 2. Platform for spatial and temporal patterning of Nodal signaling activity.
(A) Schematic of patterning experiment. One-cell embryos were injected with mRNA encoding optoNodal2 receptors. At sphere stage, embryos were mounted in custom array mounts compatible with an upright microscope. Spatial patterns of light were generated using an ultra-widefield microscope incorporating DMD-based digital projector (Fig. S4). (B) Experimental timeline. Embryos were injected with optoNodal2 mRNAs at the 1-cell stage. Embryos were kept in the dark until 4 hpf. Embryos stained for pSmad2 (panel D) were illuminated from 4-4.3 hpf, while embryos stained for lft2 or flh expression (panels E and F) were illuminated from 4-4.75 hpf. All embryos were fixed immediately following light treatment. (C-F) Demonstration of spatial patterning of Nodal signaling activity and target gene expression. (C) DMD pattern masks used for spatial patterning. (D) α-pSmad2 immunostaining (green) demonstrating spatial patterning of signaling activity. (E) Spatial patterning of flh gene expression (cyan). (F) Spatial patterning of lft2 gene expression (yellow). Embryos were double stained for lft2 and flh; each column of images in panels E and F depict the same embryo imaged in different channels. All images in panels D-F are maximum intensity projections derived from confocal images of a representative embryo. All scale bars 100 μm.

