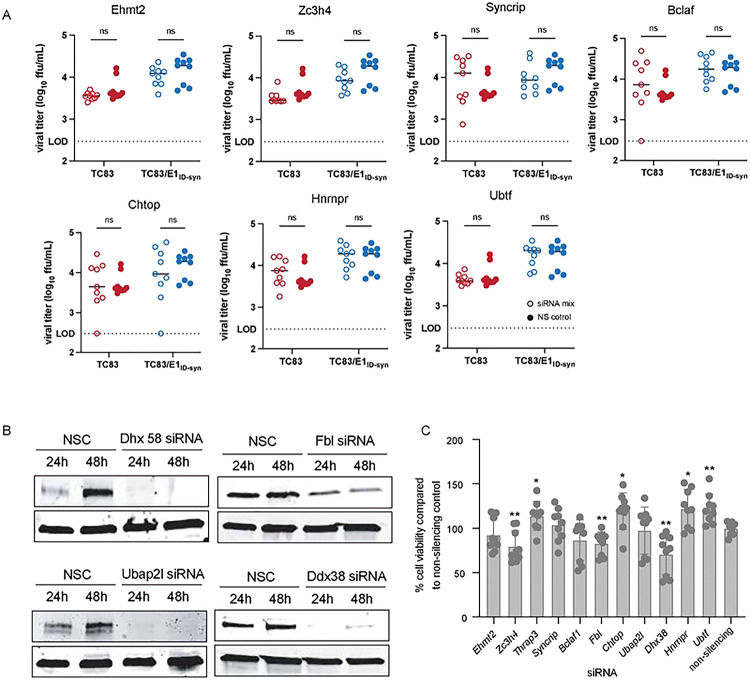
Extended Data Figure 4. Validation of additional mass spectrometry hits.
To evaluate the effect of these genes on viral replication (A) Raw264–7 cells were transfected with 10mM of a pool of 3 siRNA targeting proteins of interest for 24hrs, after which they were infected with TC83 or TC83/E1ID-syn. Supernatants were collected at 24hpi and infectious virus was titered using FFA. For visual clarity, the individual siRNAs along with the non-silencing control (NSC) are graphed individually, however the NSC is the same in all graphs. Each experiment was performed in triplicate three times independently and the mean and SD are graphed. (B) Western blot of Raw264–7 transfected for 24h or 48h with NSC or protein of interest siRNA pool (10μM). (C) Cell viability was determined using alamarblue Cell Viability Reagent and calculated as a percentage compared to the NSC. Statistical analysis was performed using GraphPad Prism 9, using an unpaired T-test. * >0.05, **>0.001.

