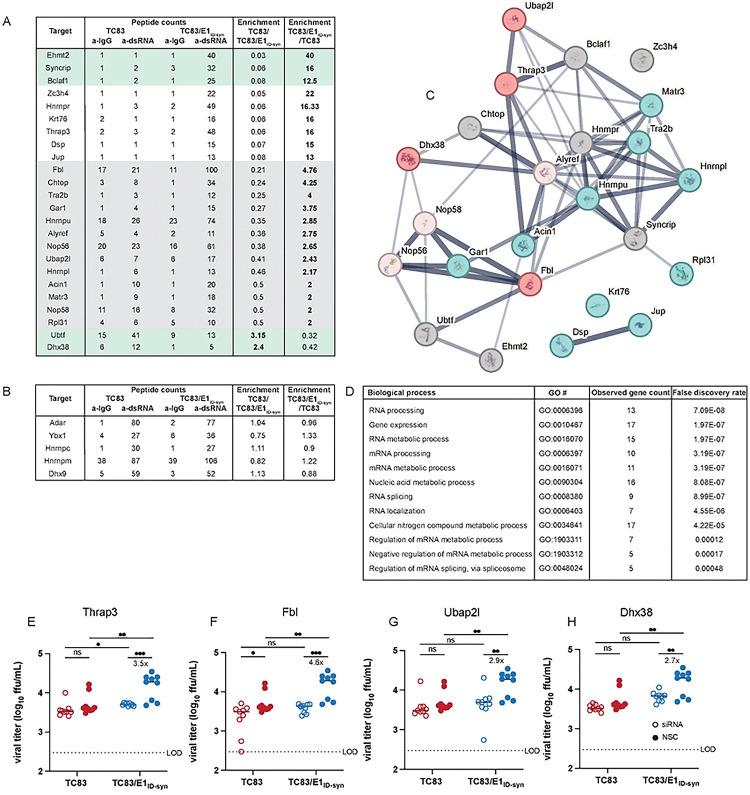
Figure 4. Increased macrophage replication fitness of TC83/E1IDsyn is dependent on expression of RNA binding proteins Fbl, Thrap3, Ubap2l, and Dhx38.
(A) Top hits from dsRNA immunoprecipitation-mass spectrometry (IP-MS) of TC83 and TC83/E1IDsyn in Raw264.7. Raw264.7 cells were infected with TC83 or TC83/E1IDsyn at an MOI of 0.1, and viral dsRNA isolated from lysates at 24 hpi using J2 dsRNA antibody [31] or IgG isotype control. RNA-bound proteins were identified by MS, and fold-enrichment of spectral counts relative to IgG controls was calculated. Prioritized hits were chosen based on fold enrichment scores, total spectral counts, and whether targets are known RNA binding proteins (RBPbase hits). (B) Hits equally enriched in TC83 and TC83/E1IDsyn. (C) STRING network analysis of top proteomics hits. Candidates meeting the cutoff criteria (A) were subjected to Protein-Protein Interaction Networks Functional Enrichment Analysis. Candidate proteins identified in the screen are highlighted in red and interacting proteins in blue. (D) Enriched biological process GO terms that with a p-value >0.001, along with the observed gene count present in the STRING network (E-H) Raw264.7 were transfected with control (NSC) or pooled (3 siRNA) gene specific siRNAs targeting (E) Thrap3, (F) Fbl, (G) Ubap2l, or (H) Dhx38 for 24 hours. Cells were infected TC83 or TC83/E1ID-syn at an MOI of 0.1, cell culture supernatants collected at 24hpi, and infectious virus titered by FFA. All siRNAs were assayed simultaneously but for visual clarity, data for each gene is shown separately along with the shared control siRNA samples. Each experiment was performed in triplicate three times independently and the mean and SD are graphed. Statistical analysis was performed using unpaired t-test. ** >0.001, ***>0.0001. Fold change and p-values are indicated on each graph.

