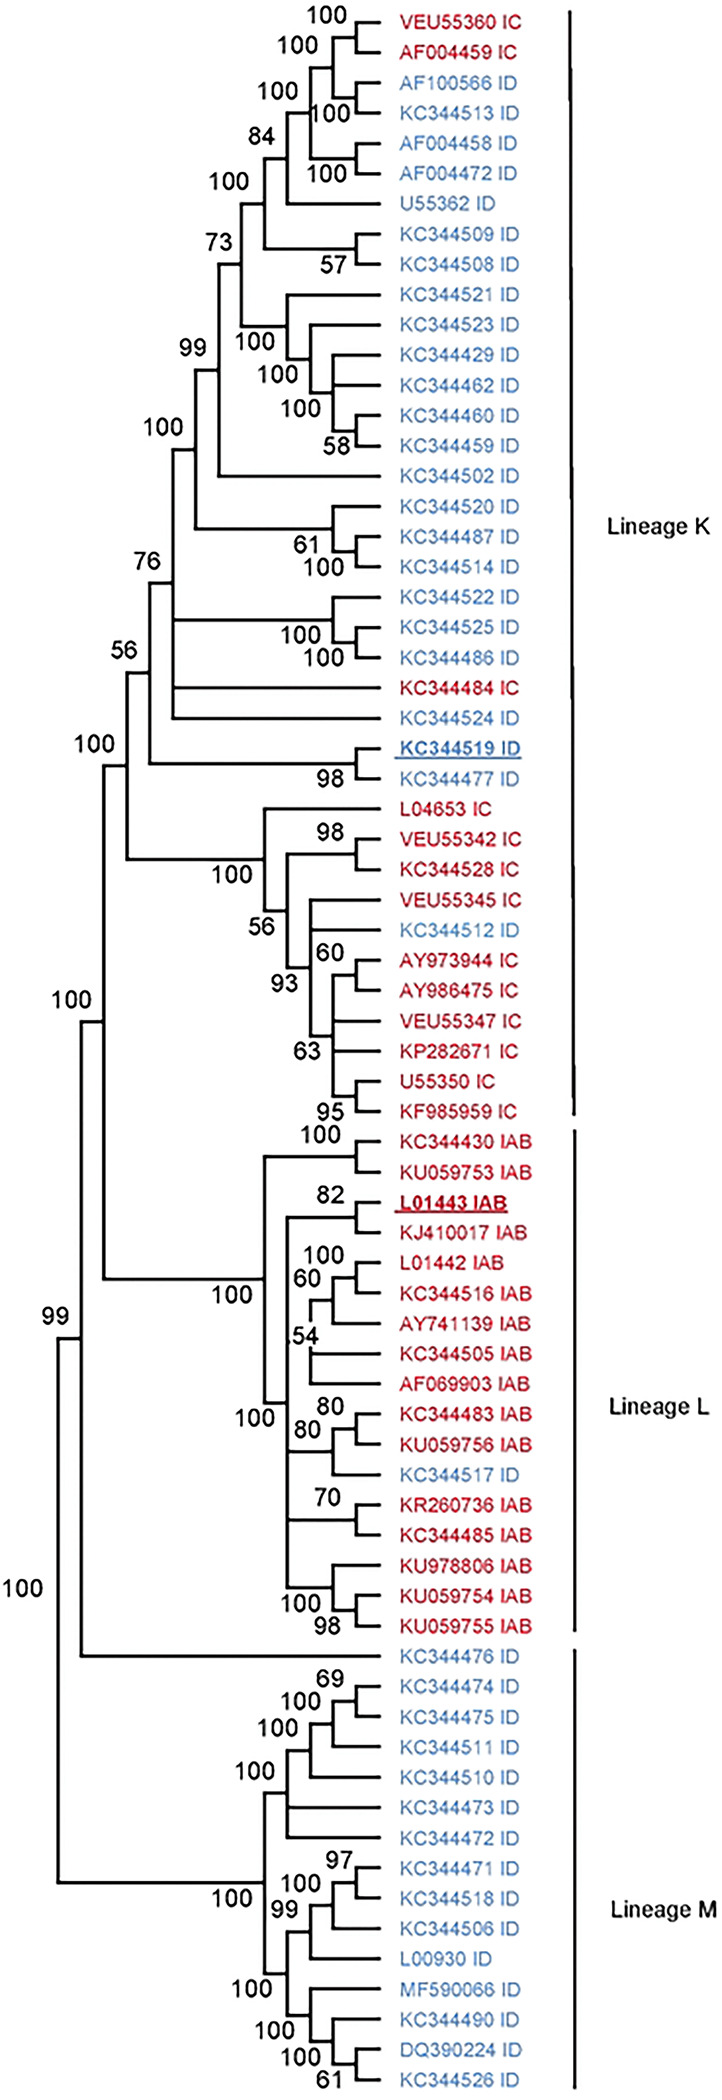
Extended Data Figure 1. Phylogenetic tree of VEEV IAB, IC and ID subtypes.

The optimal phylogenetic tree of lineages K, L and M (previously described in [39]) as determined by the neighborhood-joining method [48]. Shown next to each branch is the percentage of replicate trees in which the associated taxa clustered together in the bootstrap test (1000 replicates).
