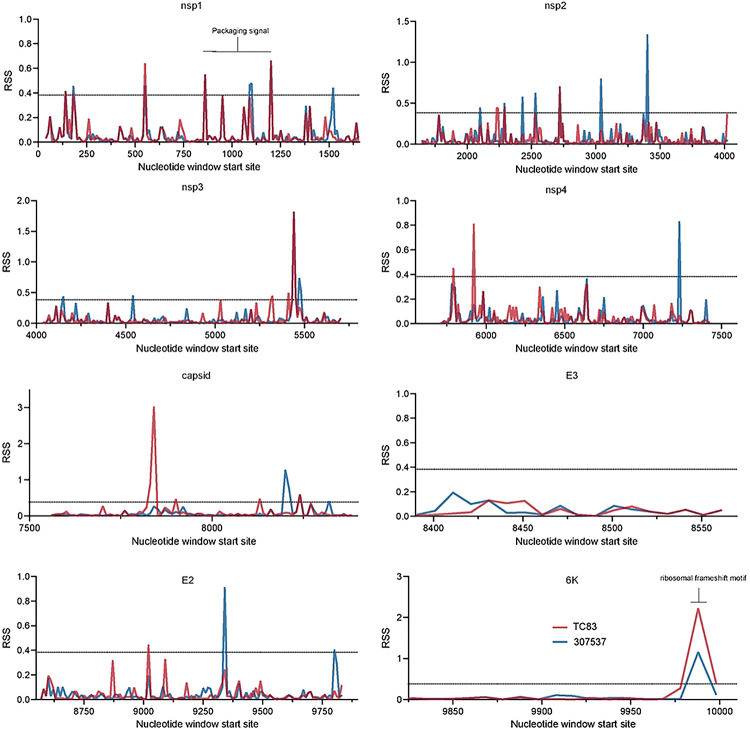
Extended Data Figure 2. Sliding window analysis of the relative structure score (RSS) across the VEEV genome broken up by gene.
The RSS was calculated as the minimum free energy (MFE)/ensemble diversity for each window of 50 nucleotides with a step size of 10. TC83 is shown in red and 307537 is shown in blue. Two standard deviations from the mean was calculated across the entire genome and is represented as a dotted line.

