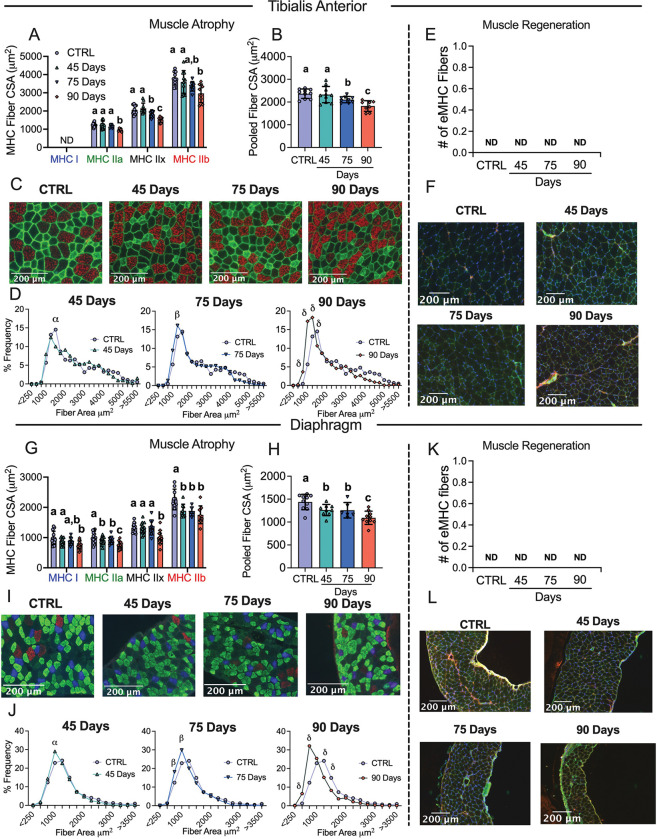
Figure 3. Evaluation of tibialis anterior and diaphragm fiber type atrophy and fiber regeneration in epithelial ovarian cancer injected mice.
Analysis of fiber histology on myosin heavy chain (MHC) isoforms and eMHC was performed in control and EOC mice. Cross-sectional area (CSA) of MHC isoforms were evaluated in the tibialis anterior (A-C, n = 7–10). All fiber types were also pooled, binned and averaged based off fiber area and plotted by frequency distribution at each time point compared to control (D, n =7–10). Embryonic MHC (eMHC) was tagged in separate sections to evaluate the presence of new fibers (E & F, n = 7–10). This was repeated within the diaphragm (G-L, n 10 = 14). Results represent mean ± SD. Lettering denotes statistical significance when different from each other (p < 0.05). α p < 0.05 Control versus 45 Days; β p < 0.05 Control versus 75 Days; δ p < 0.05 Control versus 90 Days. A one-way ANOVA was used for figures A, B, G and H. Data that was not normally distributed was analyzed with a Kruskal-Wallis test. A two-way ANOVA was used for figures D and J (interactions shown only). All ANOVAs were followed by a two-stage step-up method of Benjamini, Krieger and Yukutieli multiple comparisons test. C57BL/6J female mice ~75 days post PBS injection as controls (CTRL); C57BL/6J female mice ~45 days post ovarian cancer injection (45 Days); C57BL/6J female mice ~75 days post ovarian cancer injection (75 Days); C57BL/6J female mice ~90 days post ovarian cancer injection (90 Days).

