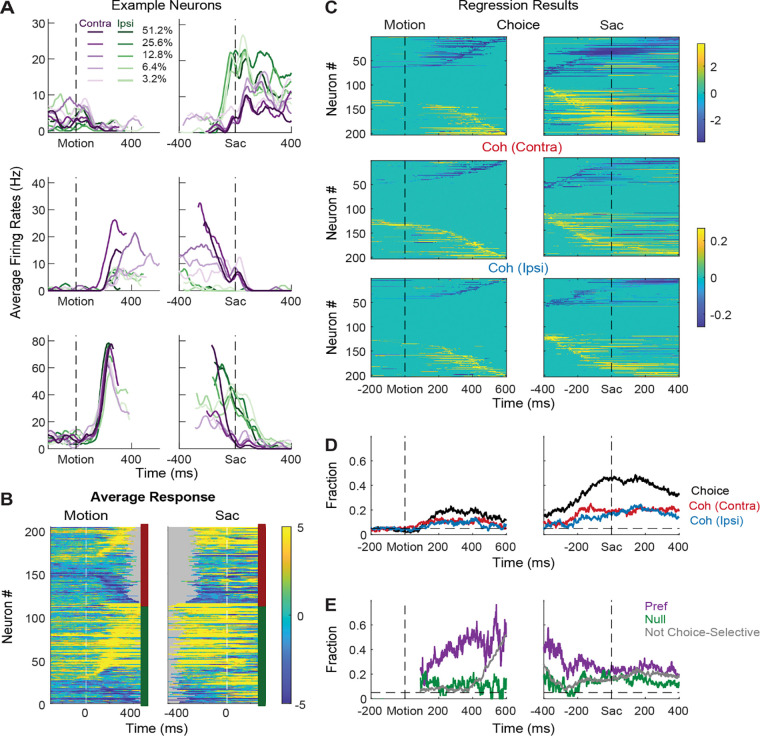
Figure 2. STN neurons have diverse response profiles.
A, Activity of three STN neurons (rows) aligned to motion (left) and saccade (right) onsets and grouped by choice x motion coherence (see legend). For motion-onset alignment, activity was truncated at 100 ms before saccade onset. For saccade-onset alignment, activity was truncated before 200 ms after motion onset. B, Summary of average activity patterns. Each row represents the activity of a neuron, z-scored by baseline activity in a 300 ms window before target onset and averaged across all trial conditions. Rows are grouped by monkey (red and green shown to the right of each panel: monkeys C and F, respectively) and sorted by the time of peak values relative to motion onset. Only correct trials were included. C, Heatmaps of linear regression coefficients for choice (top), coherence for trials with contralateral choices (middle), and coherence for trials with ipsilateral choices (bottom), for activity aligned to motion (left) and saccade (right) onsets. Regression was performed in running windows of 300 ms. Regression coefficients that were not significantly different from zero (t-test, p>0.05) were set to zero (green) for display purposes. Neurons were sorted in rows by the time of peak coefficient magnitude. Only correct trials were included. D, Time courses of the fractions of regression coefficients that were significantly different from zero (t-test, p<0.05), for choice (black), coherence for trials with contralateral choices (red), and coherence for trials with ipsilateral choices (blue). Dashed line indicates chance level. E, Time courses of the fractions of non-zero regression coefficients for coherence. Separate fractions were calculated for trials with the preferred (purple) and null (green) choices from choice-selectivity activity and for all trials from activity that was not choice selective (gray). Only time points after motion onset with fractions > 0.05 for choice-selective activity were included. Dashed line indicates chance level.

