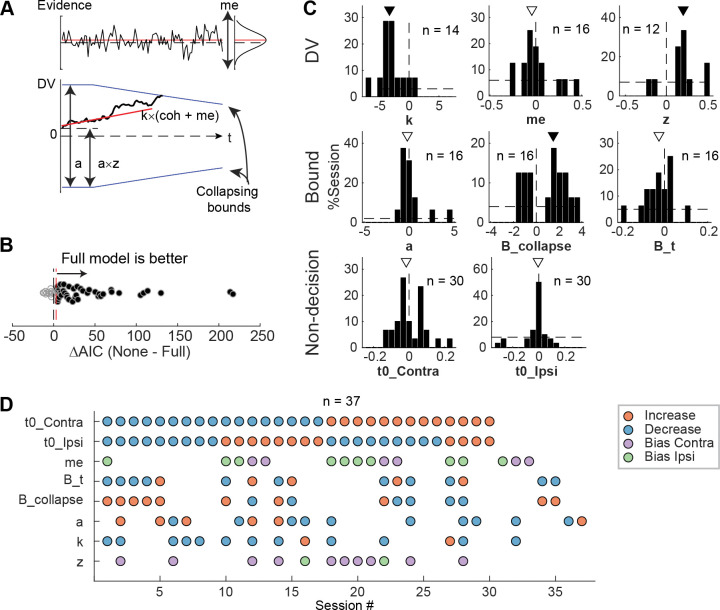
Figure 5. STN microstimulation affected multiple computational components in the DDM.
A, Illustration of the DDM. Red/black lines represent across-trial mean/single-trial example of the evidence (top) and drift rate (bottom). Blue lines represent the collapsing decision bounds. B, Distribution of the difference in AIC between the None and Full models. Red dashed line indicates the criterion for choosing the full model: AIC difference = 3. C, Histograms of microstimulation effects on DDM parameters. Each histogram included only sessions in which the Full model outperformed the corresponding reduced model (e.g., the histogram for parameter a included only sessions in which AICNoA – AICFull > 3 and AICNone – AICFull > 3). Triangles indicate median values. Filled triangles: Wilcoxon sign rank test, p < 0.05. D, Summary of microstimulation effects on all parameters, for sessions in which at least one significant effect was present. Sessions were sorted by the prevalence and sign of the effects.

