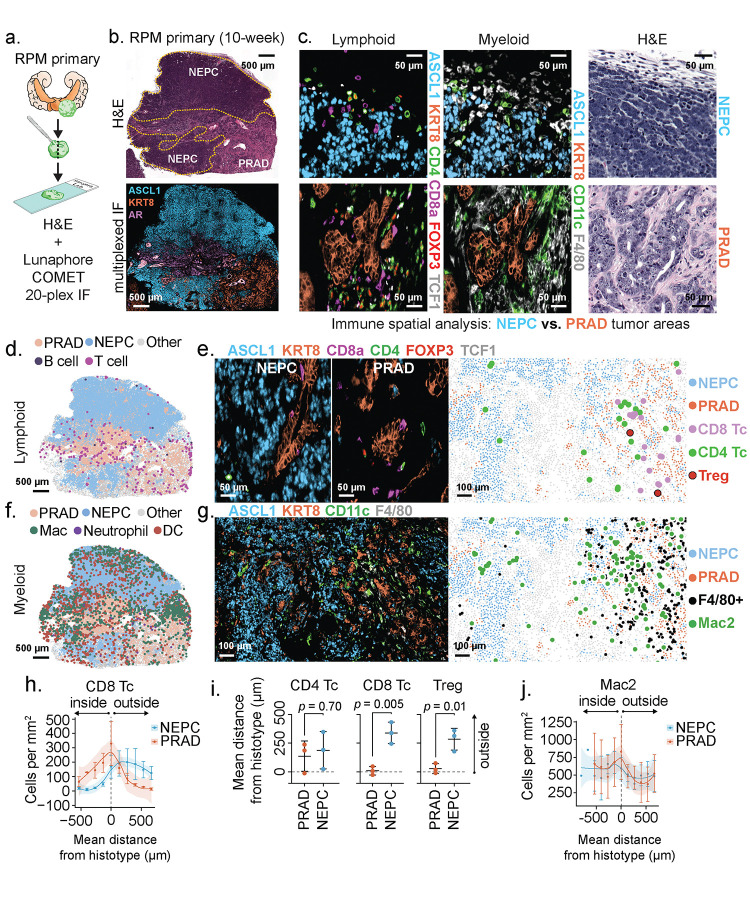
Figure 3: Multiplexed immunofluorescence identifies unique spatial distribution of immune cells within RPM prostate tumors, with local depletion of immune cell types in NEPC areas.
a. Schematic representation of the methods used to process RPM tumors for 20-plex cyclic immunofluorescence. b. (Top) Representative H&E and (bottom) serial section depicting a 3-marker pseudo-colored 10-week RPM tumor. Histological regions (PRAD vs. NEPC) are denoted in the H&E and demarcated by dotted yellow line. c. Representative enhanced magnification of lymphoid (left) and myeloid cell markers (middle), and serially sectioned H&E (right). d. Representative segmented field of view (FoV) for the indicated general lymphoid cell types in a 10-week RPM tumor. e. Representative immunofluorescence of the indicated pseudo-colored lymphocyte markers within NEPC (left) or PRAD (middle). (Right) Data presented as a segmented FoV indicating the localization of each lymphoid and tumor cell type in space. f. Representative segmented field of view (FoV) for the indicated general myeloid cell types in a 10-week RPM tumor. g. Representative immunofluorescence of the indicated pseudo-colored myeloid and tumor histotype markers. (Right) Segmented FoV indicating the localization of each myeloid and tumor cell type in space. h. Frequency distribution of CD8+ T cells within binned distance outside or inside the defined interface region (NEPC or PRAD). Scale bar represents mean and standard error of the mean of the cell counts per bin. i. Mean distance of the indicated cell types to the nearest histotype boundary. Error bars denote mean and standard deviation. j. Frequency distribution of Mac2 cells (CD11blo; CD11c+; F4/80+) within each binned distance outside or inside of the defined interface region (NEPC or PRAD). Scale bar represents mean and standard error of the mean of the cell counts per bin. Data calculated as in h. Shaded regions in panels h and j approximated through Loess method. Dotted line in h-j represents the boundary of the tumor histotype or tumor edge. All scale bars denoted within each panel. Data derived from n=3 independent tumor samples. Infiltration analyses representative of n>3 distinct NEPC and PRAD boundaries.

