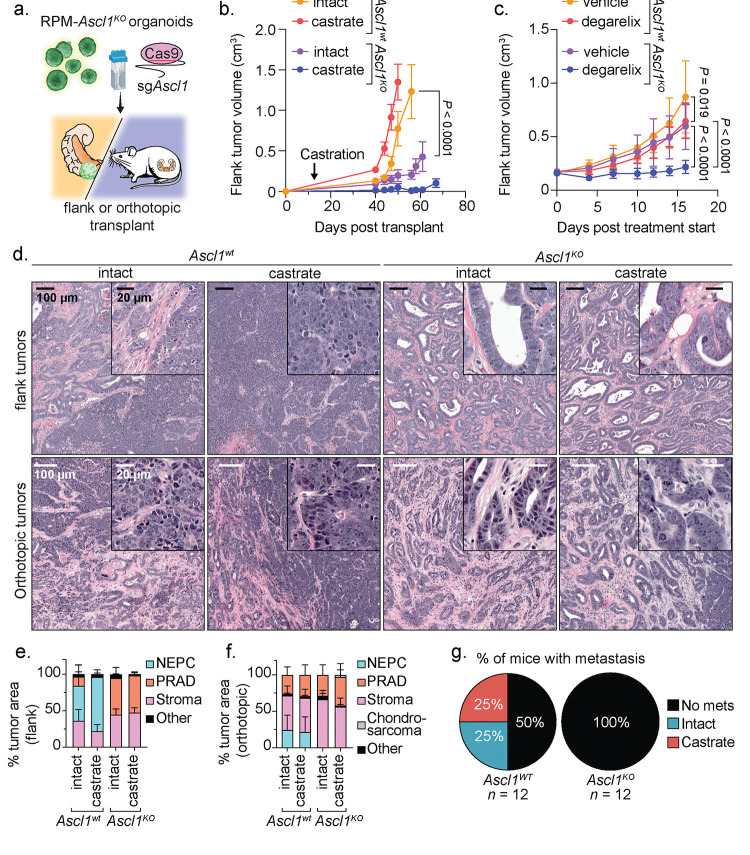
Figure 6: Loss of Ascl1 results in abrogated NEPC establishment and castration-sensitivity.
a. Schematic for the generation of RPM-Ascl1WT and RPM-Ascl1KO tumors transplanted into the flanks or prostates of immunocompetent C57BL6/J hosts. b. Longitudinal subcutaneous (SQ) tumor volumes of the indicated tumor genotypes and host backgrounds. Statistics derived using two-way ANOVA with Tukey’s multiple comparisons correction for data collected between days 0–56 to ensure equal sample size comparisons. Error bars denote mean and standard error of the mean. n=6 independent tumors across each group. Castration or sham surgery performed 14 days post SQ transplantation. c. Longitudinal SQ tumor volumes of the indicated tumor genotypes and host backgrounds. Statistics derived using two-way ANOVA with Tukey’s multiple comparisons correction for data collected between 0–16 days post treatment start to ensure equal sample size comparisons. Error bars denote mean and standard deviation. Ascl1WT-vehicle, Ascl1WT-vehicle, and Ascl1KO-degarelix, n=8; Ascl1KO-vehicle, n=9 independent tumors. Vehicle or degarelix treatment was initiated upon tumor establishment (≥150 mm3). d. Representative H&E of SQ (top) and OT (bottom) tumors isolated at endpoint. Genotype and treatment groups listed within the figure panel. Data related to mice in Fig. 5b–c. Scale bars denoted within the figure panel. Data are representative of 4–6 independent tumors per experimental group. e. Stacked bar charts representing percentage of OT tumor area composed of the histological categories depicted in the figure legend. Data are quantified histology of tumors generated in Fig. 5b and represent average tumor area. f. Stacked bar charts representing percentage of SQ tumor area composed of the histological categories depicted in the figure legend. Data are quantified histology of tumors generated in Fig. 5c and represent the average tumor area. g. Pie charts representing percentage of mice with metastatic disease (regional and distal) in intact or castrated hosts of the indicated genotypes. Statistics derived from two-sided Fisher’s exact test, p=0.0137. Number of biological replicates indicated in the figure panel. All scale bars denoted in the figure panels.

