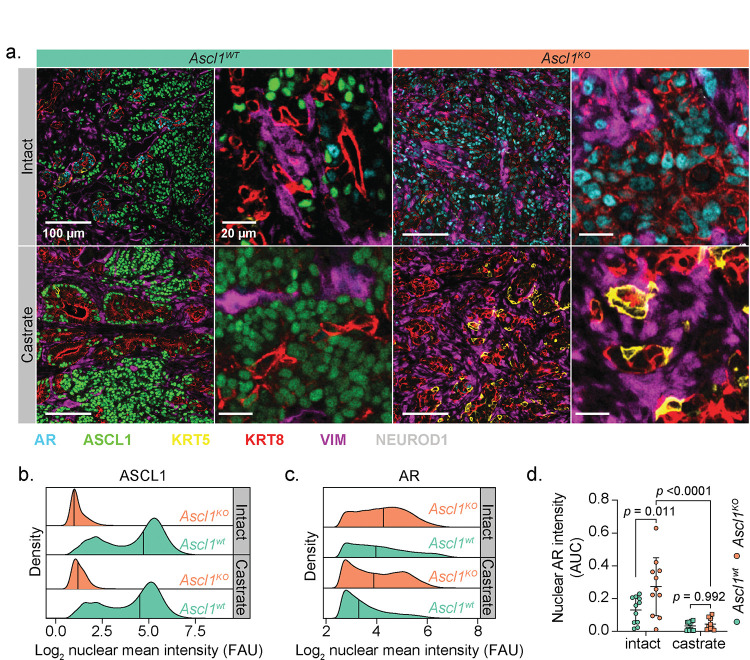
Figure 7: Loss of Ascl1 results in enhanced AR expression and proportion of KRT8+ tumor cells.
a. Representative confocal images of the tumors isolated from mice in Fig. 5b–c. Scale bars and pseudocolor legend indicated within the figure. b. Density plots of the log2(x+1) transformed ASCL1 mean fluorescence intensity from all (OT and SQ) tumor cells. Tumor cells subset by all cells staining negatively for VIMENTIN. Tumor genotype and treatment indicated in the figure panel. Data derived from n<10 independent RPM tumors per group. c. Density plots of the log2(X+1) transformed AR mean fluorescence intensity from all OT tumor cells within the indicated genotypes and treatment groups. Tumor cells subset by all cells staining negatively for VIMENTIN and positively for KRT8 and AR. d. Area under the curve for all KRT8+:AR+ tumor cells (VIMENTIN−) across both SQ and OT tumor transplants, containing a log2 transformed nuclear AR intensity score ≥3. Statistics derived using two-way ANOVA with Tukey’s multiple comparisons correction. Error bars indicate mean and standard deviation. Combined OT and SQ tumor sample sizes for all quantification and analysis performed in Fig. 7: n=11 (Ascl1wt and Ascl1KO intact groups), n=12 (Ascl1wt castrate group), n=9 (Ascl1KO castrate group). FAU=fluorescence arbitrary units.

