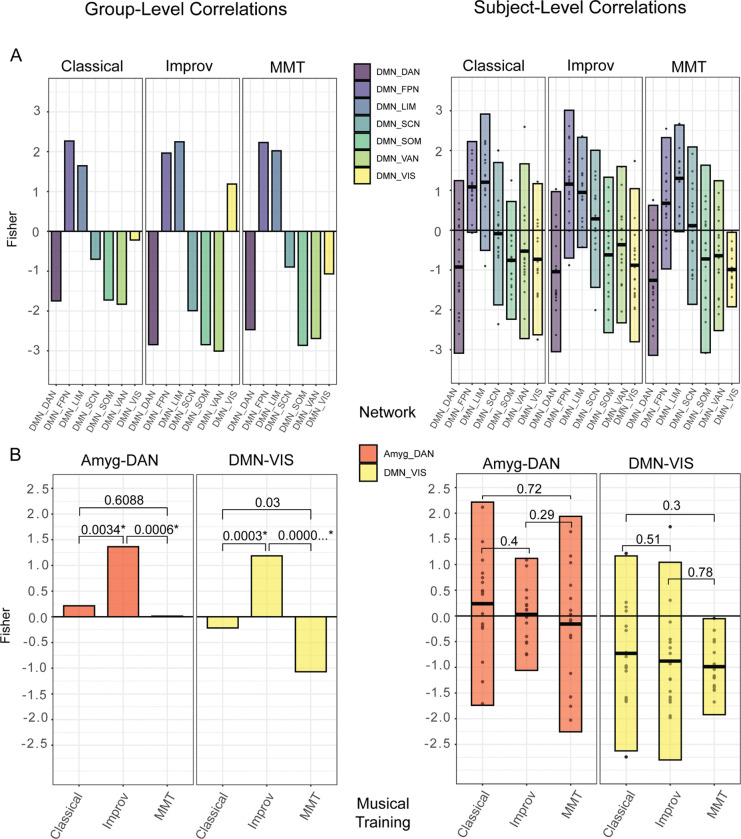
Figure 3:
A) group (left) and individual (right) QPP correlations between all networks and the DMN. B) Group and individual QPP correlations only between the Amyg-DAN and DMN-VIS, respectively. The improv group showed significantly higher FC between Amyg-DAN and DMN-VIS compared to classical and MMT. Group level p-values generated with cocor tool (Diedenhofen and Musch, 2015), individual level p-values generated with Kruskal-Wallis test for multiple comparisons in R studio. A Bonferroni adjusted significance threshold of .007 was used for both subject-wise and group comparisons, assuming a multiple comparison correction of .05/7 (assuming 7 network comparisons between the 8 networks defined).

