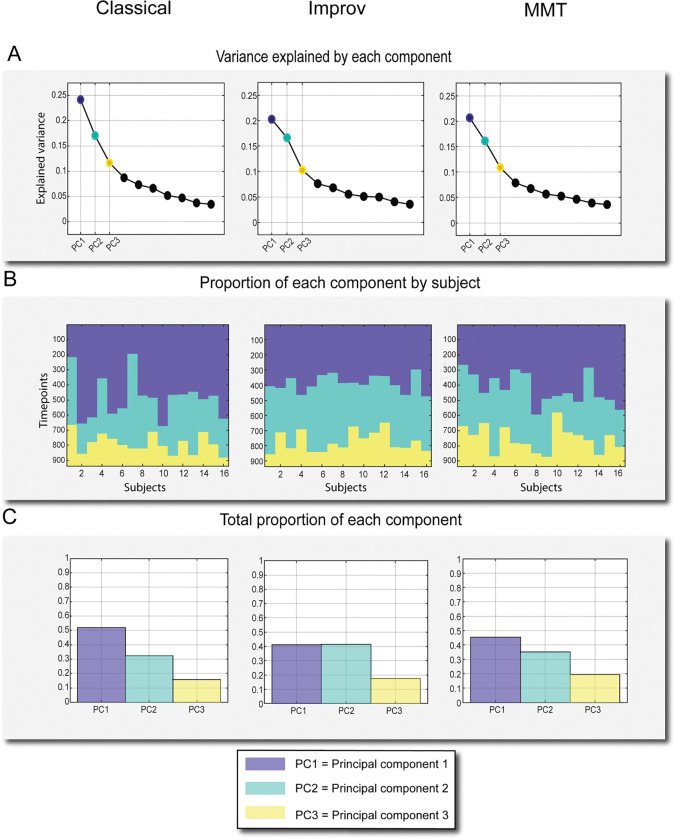
Figure 4:
Explained variance and occurrence of top three components from complex PCA. A) Explained Variance of the top 10 components, top 3 highlighted. B) Top 3 components’ respective proportions plotted against 937 timepoints. C) Proportion of each of the three components over the course of the scan out of 1.

