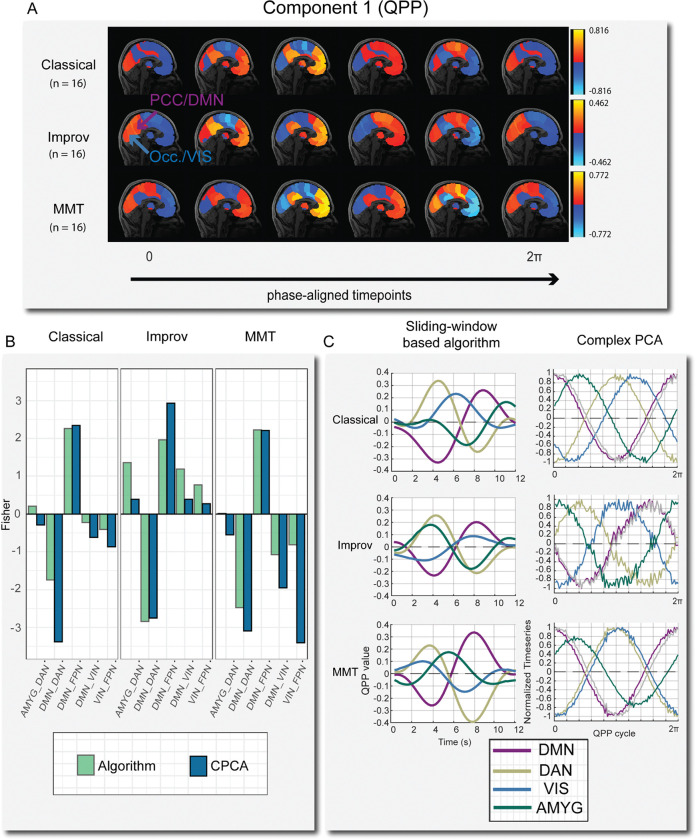
Figure 5:
A) One full phase (zero to 2π) of group-level cPCA detected QPP time-courses mapped onto brain space. Time-courses were manually phase adjusted into 6 time points. Note that in the improv group the posterior-cingulate cortex (PCC) is highly correlated with primary visual cortex (occipital lobe) at various time points, where in the classical and minimally trained musicians these two regions are always anti-correlated. B) Comparison of group-level correlation results between the sliding window-based algorithm and cPCA for selected networks. The overall network trends are very similar in both approaches. C) Waveform plots of normalized BOLD activity from QPP algorithm (left) and cPCA approach (right) for one full cycle of the QPP.

