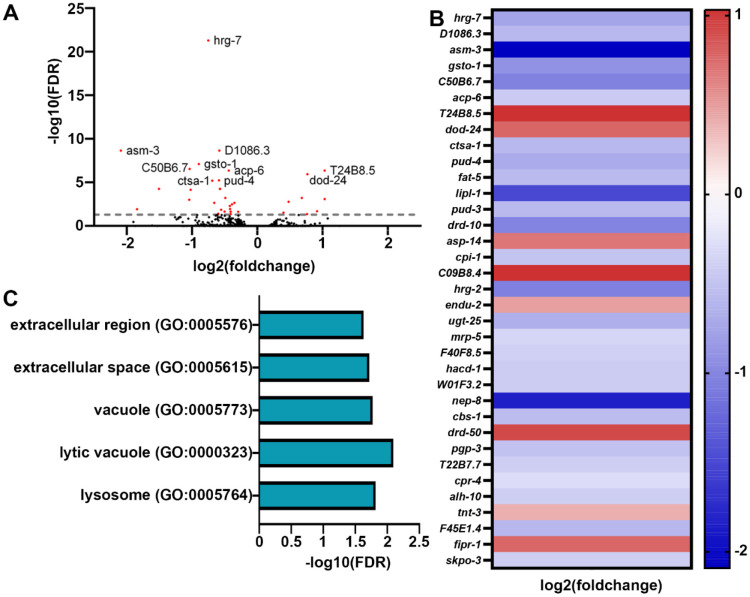
Fig. 3. Transcriptome analysis reveals minor changes in gene expression in animals grown on stiffer substrates.
(A) Volcano plot of differentially expressed genes of animals grown on stiff (4%) agar compared to standard (2%) agar. Every dot is a single gene, where red dots indicate genes with p-value < 0.05 and black dots indicate genes with p-value > 0.05. (B) Heat map of all differentially expressed genes in worms grown on 4% agar where warmer colors indicate higher expression and cooler colors indicate lower expression. A list of all genes are available in Table S2. (C) Gene ontology enrichments for differentially expressed genes (p-value < 0.05) in worms grown on 4%` agar.

